
Executive Dashboard
Learn what an executive dashboard is, what to put on one, and how to build a view that helps leaders make faster, more confident decisions.
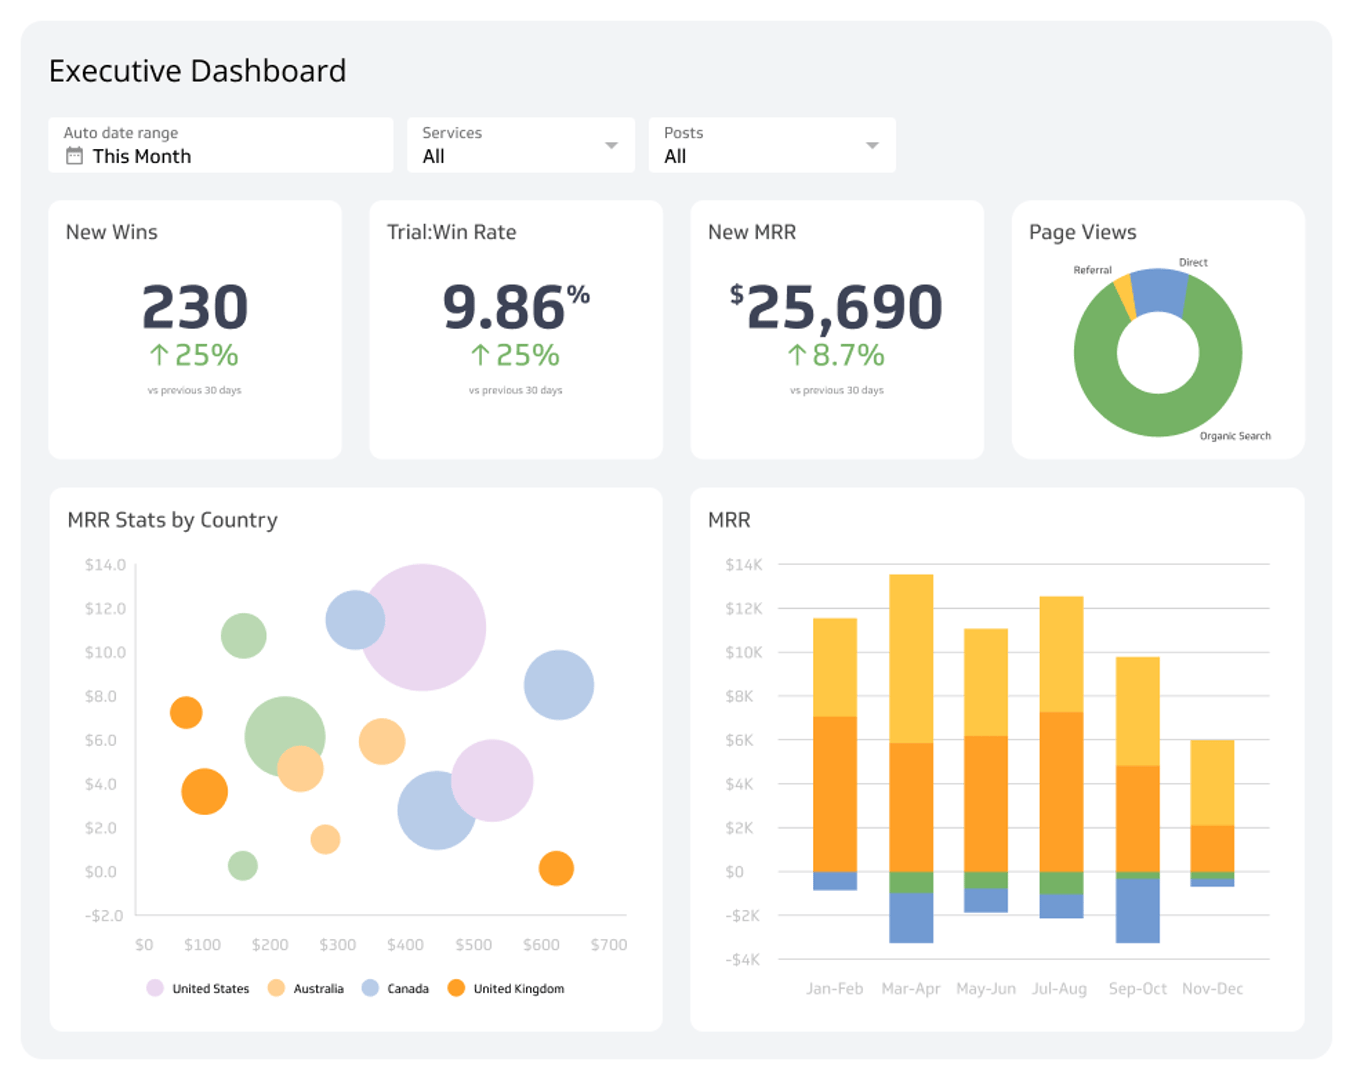
What is an executive dashboard?
An executive dashboard aggregates key performance indicators (KPIs) from across a business into a single, real-time view built for fast, confident decisions.
Designed for corporate leaders, executive dashboards surface the numbers that matter most — so you can spot risks early, track progress against goals, and act without waiting for someone to pull a report. Instead of pasting figures into a spreadsheet or explaining your business context to a generic AI tool from scratch, the data is always there, consistent and current.
By connecting to your real data sources, these dashboards replace manual effort with clarity — so your decisions are grounded in fact, not instinct.
Executive Dashboard Examples
- Executive
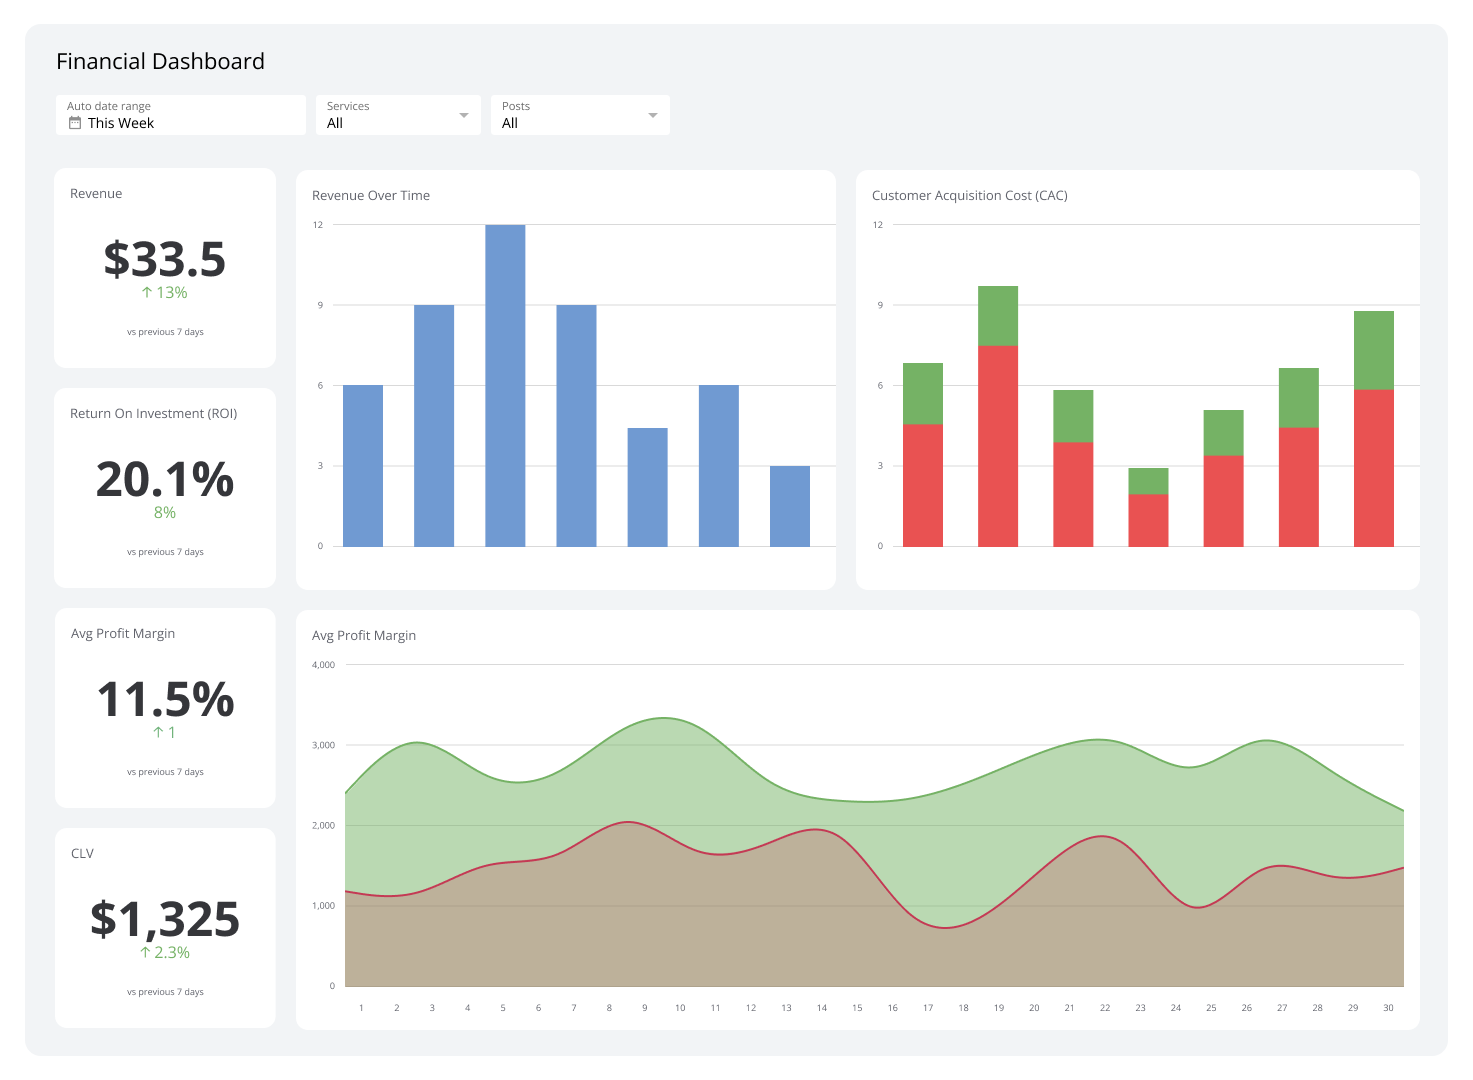
Financial Dashboard
See your revenue, expenses, and cash flow in one place — so you can make faster, more confident financial decisions.
- Executive
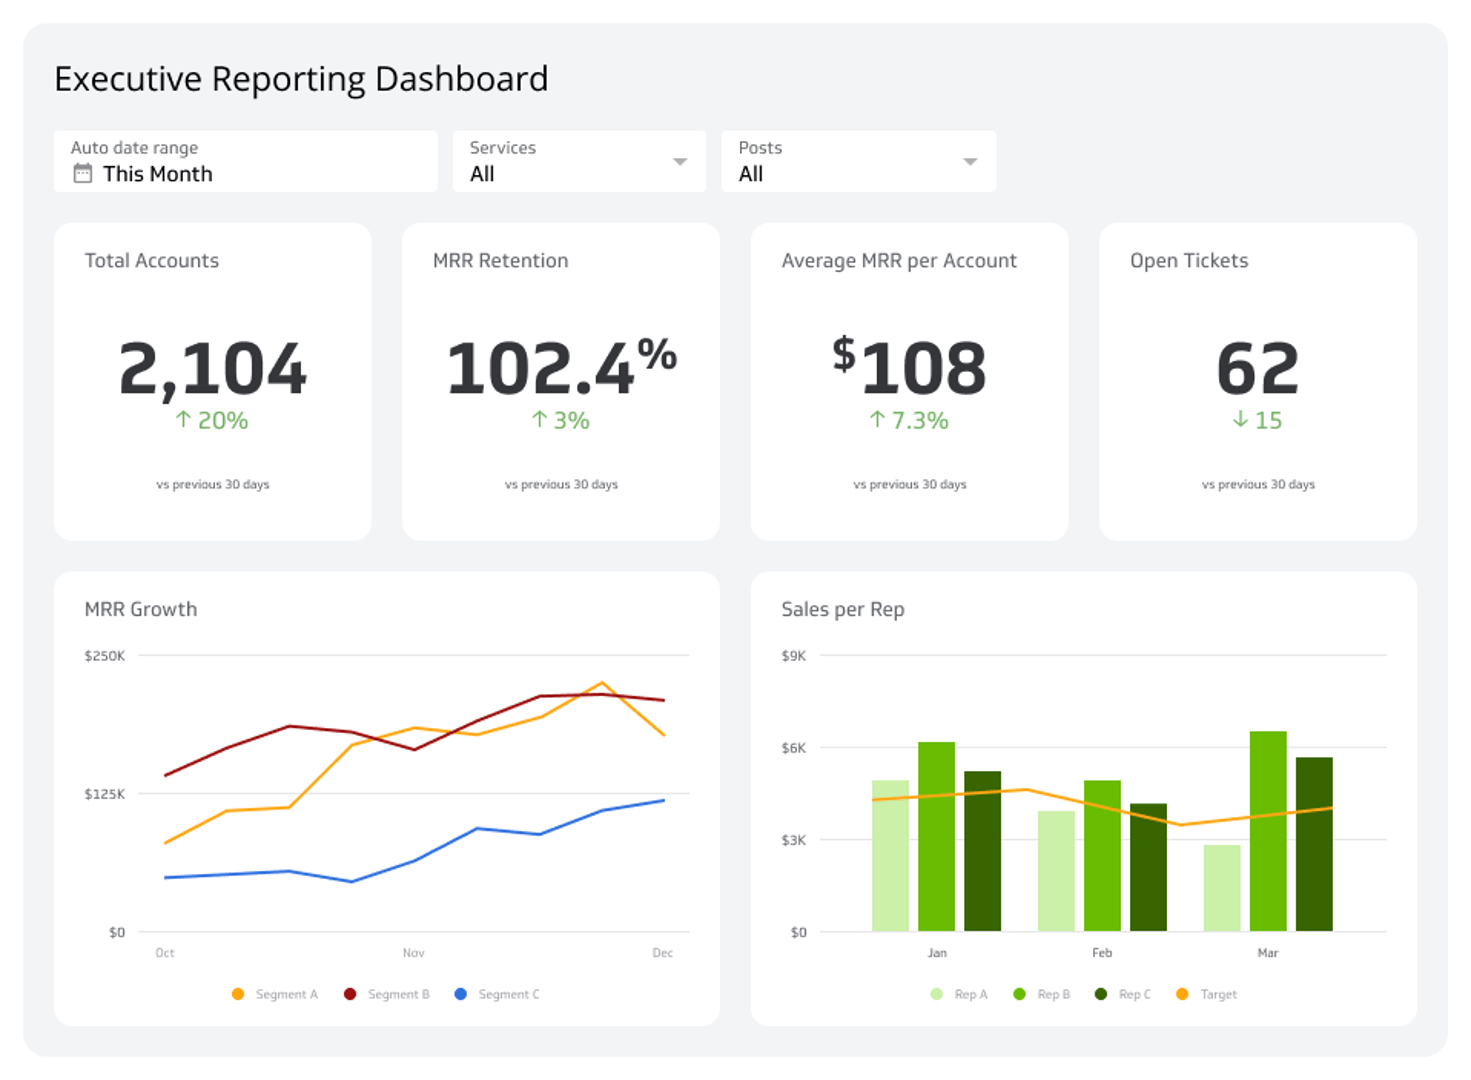
Executive Reporting Dashboard
See the "what" of your business, fast.
- Executive
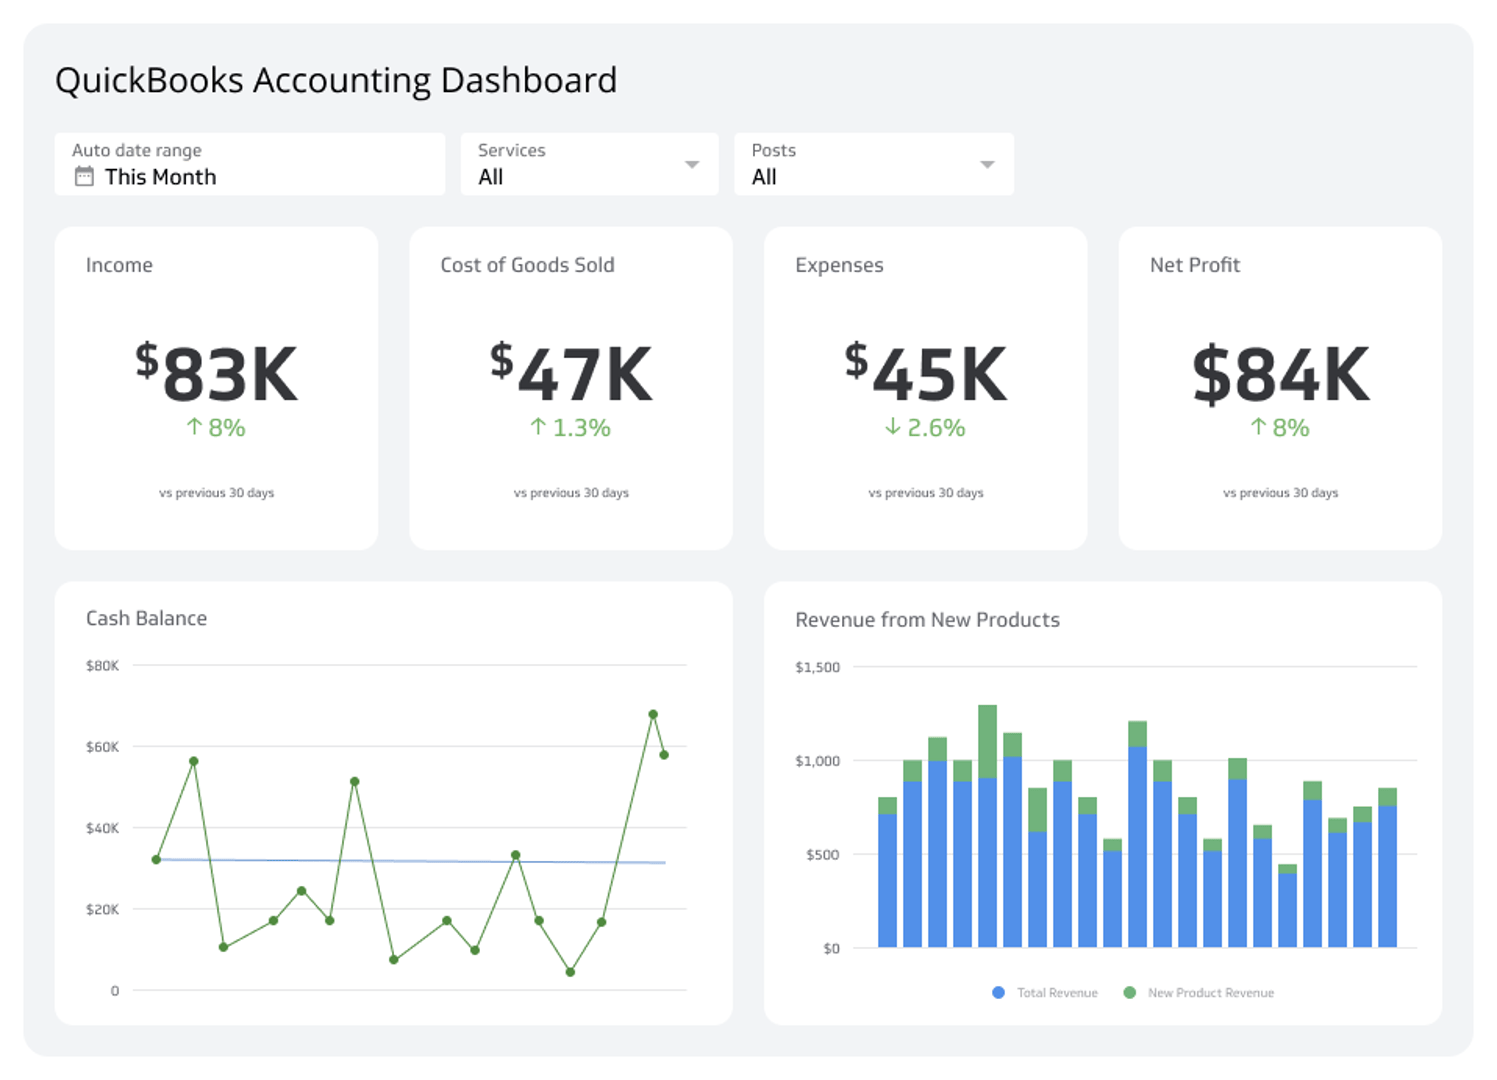
QuickBooks Dashboard
Your business's financial health at a glance.
- Executive
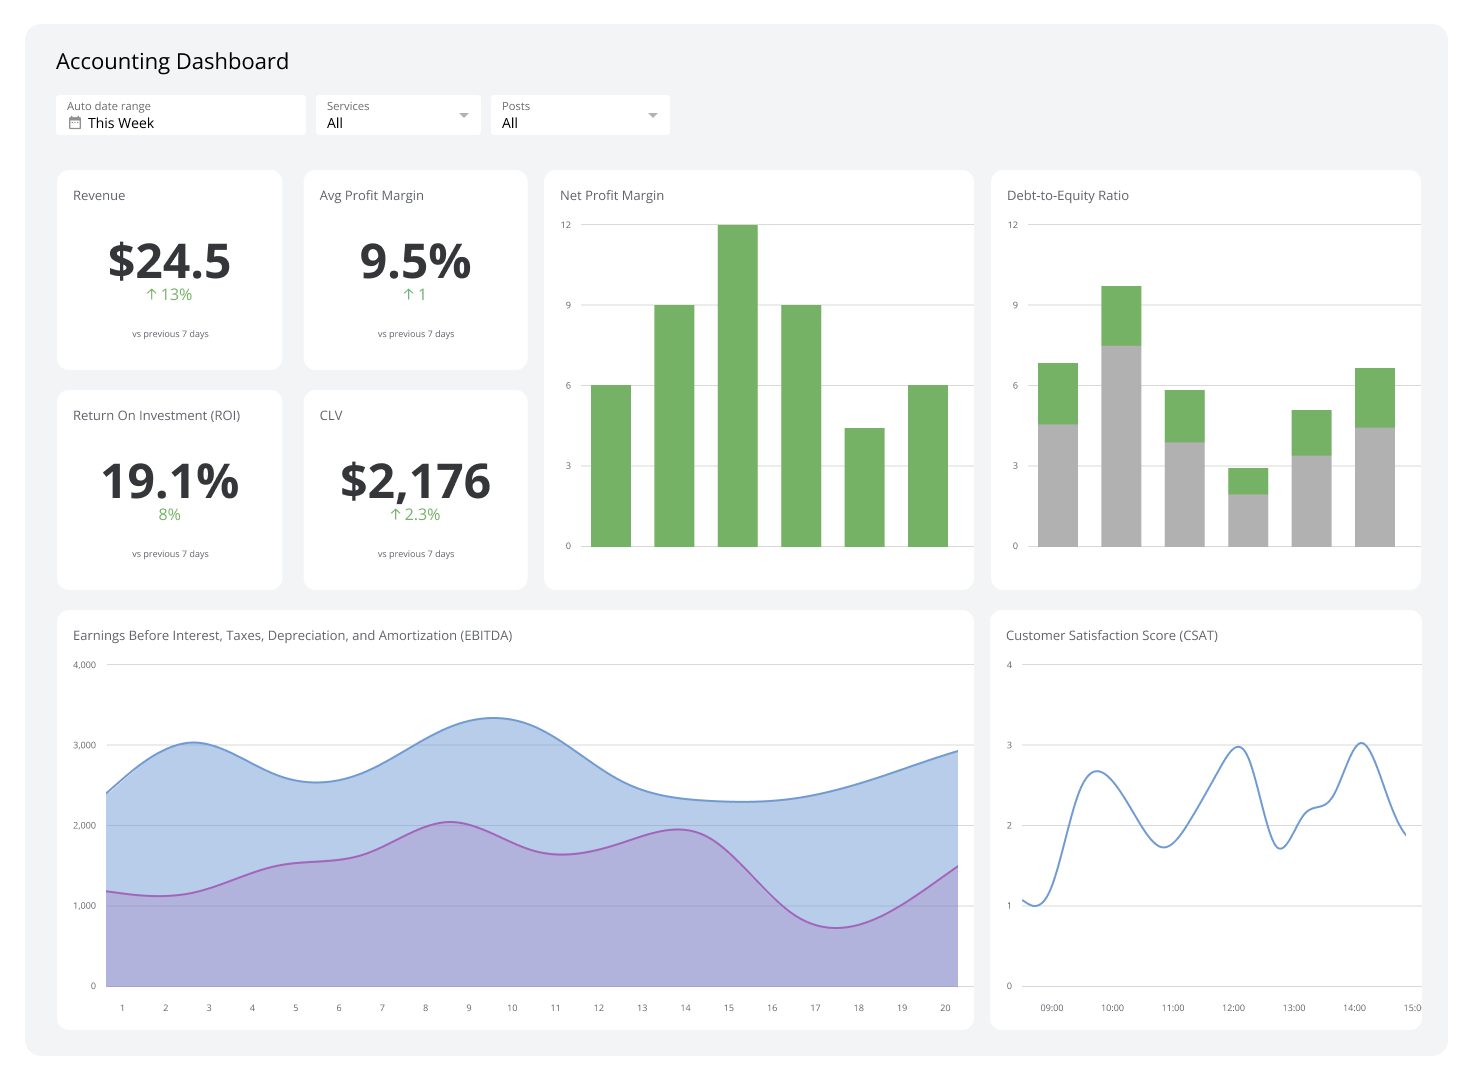
Accounting Dashboard
Your company's financial performance in real-time.
- Executive
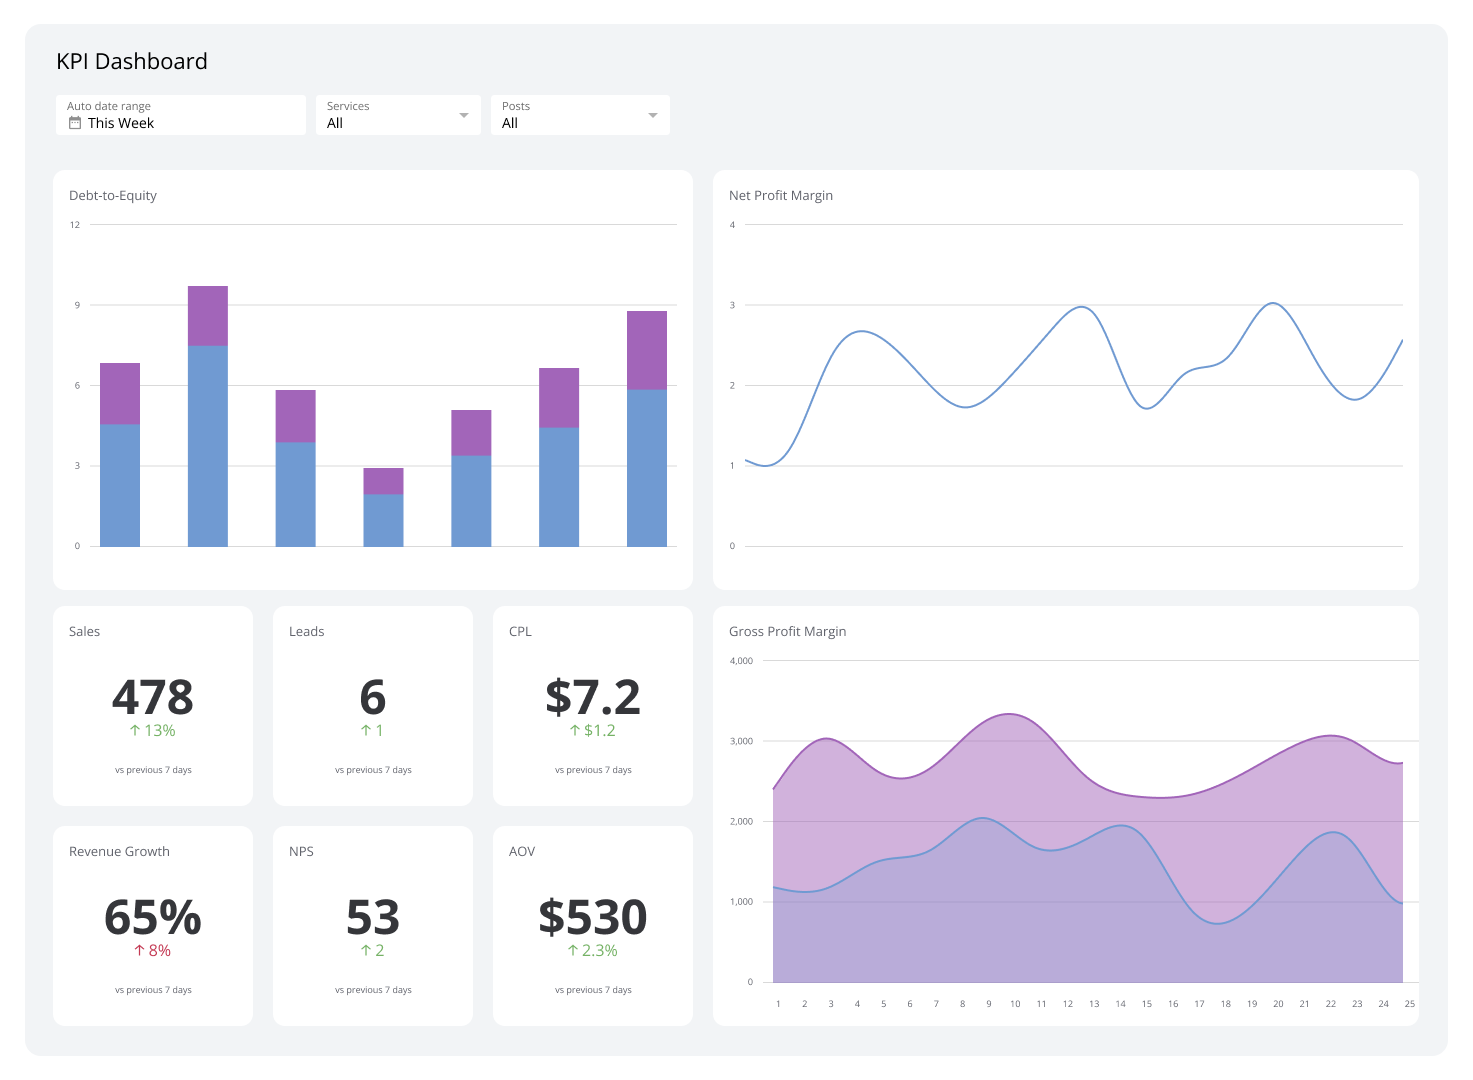
KPI Dashboard
A KPI dashboard consolidates your key metrics into a single, real-time view — so every team stays aligned and every decision is backed by accurate data.
- Executive
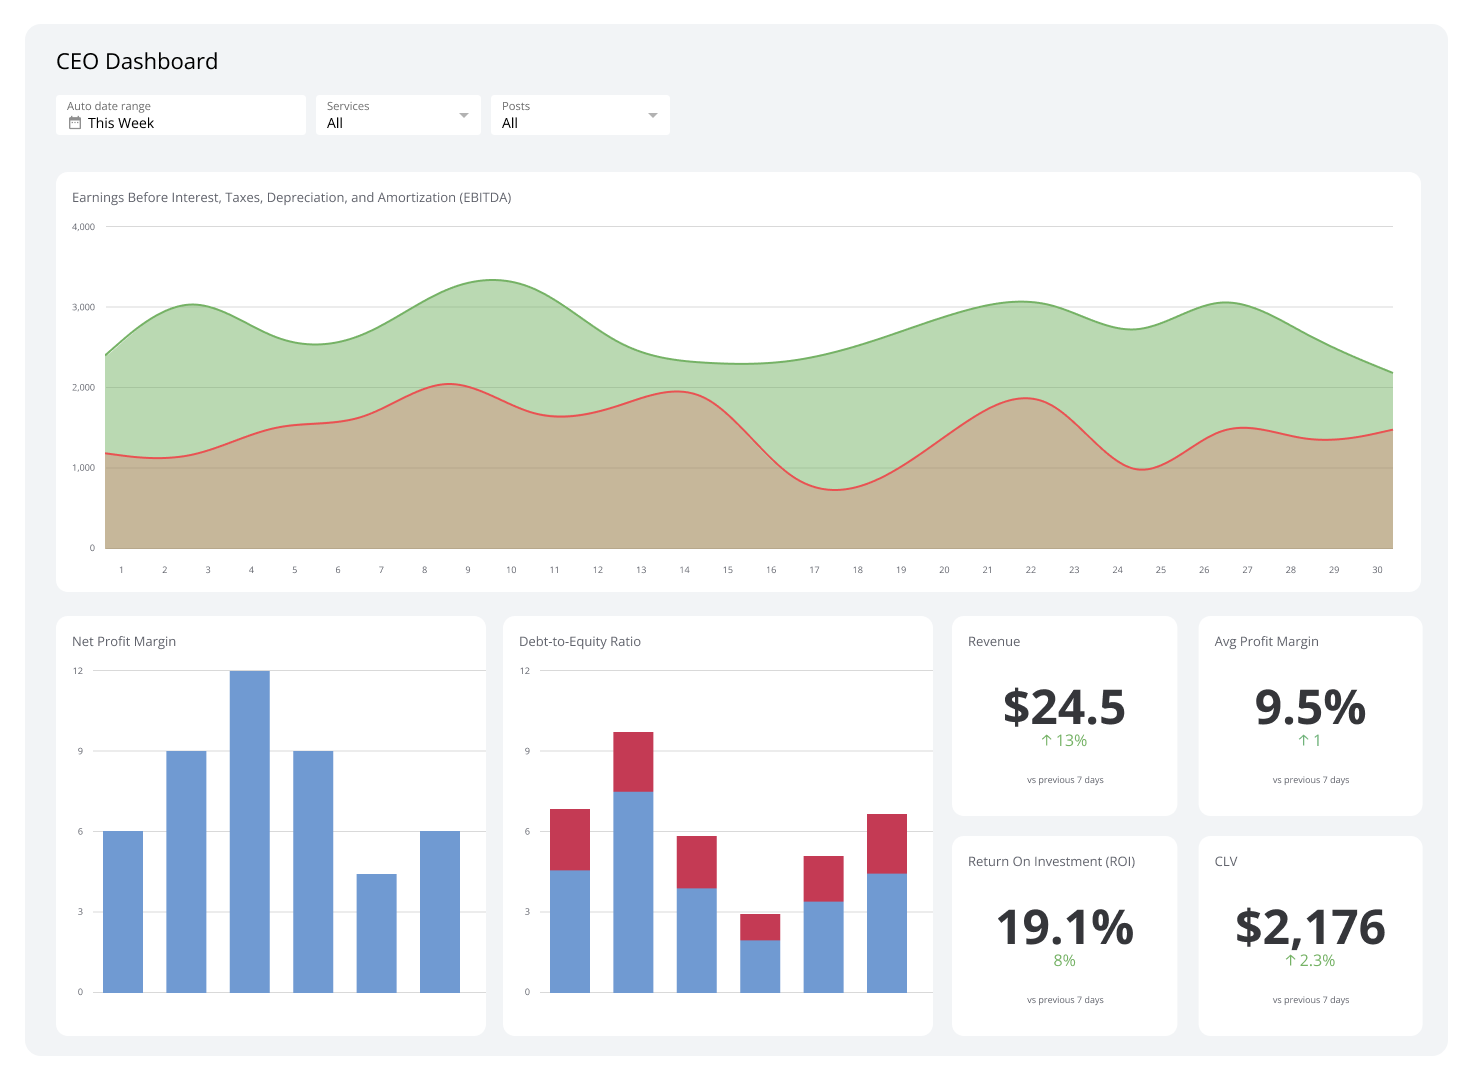
CEO Dashboard
Track revenue, customers, and operations in one executive view.
- Executive
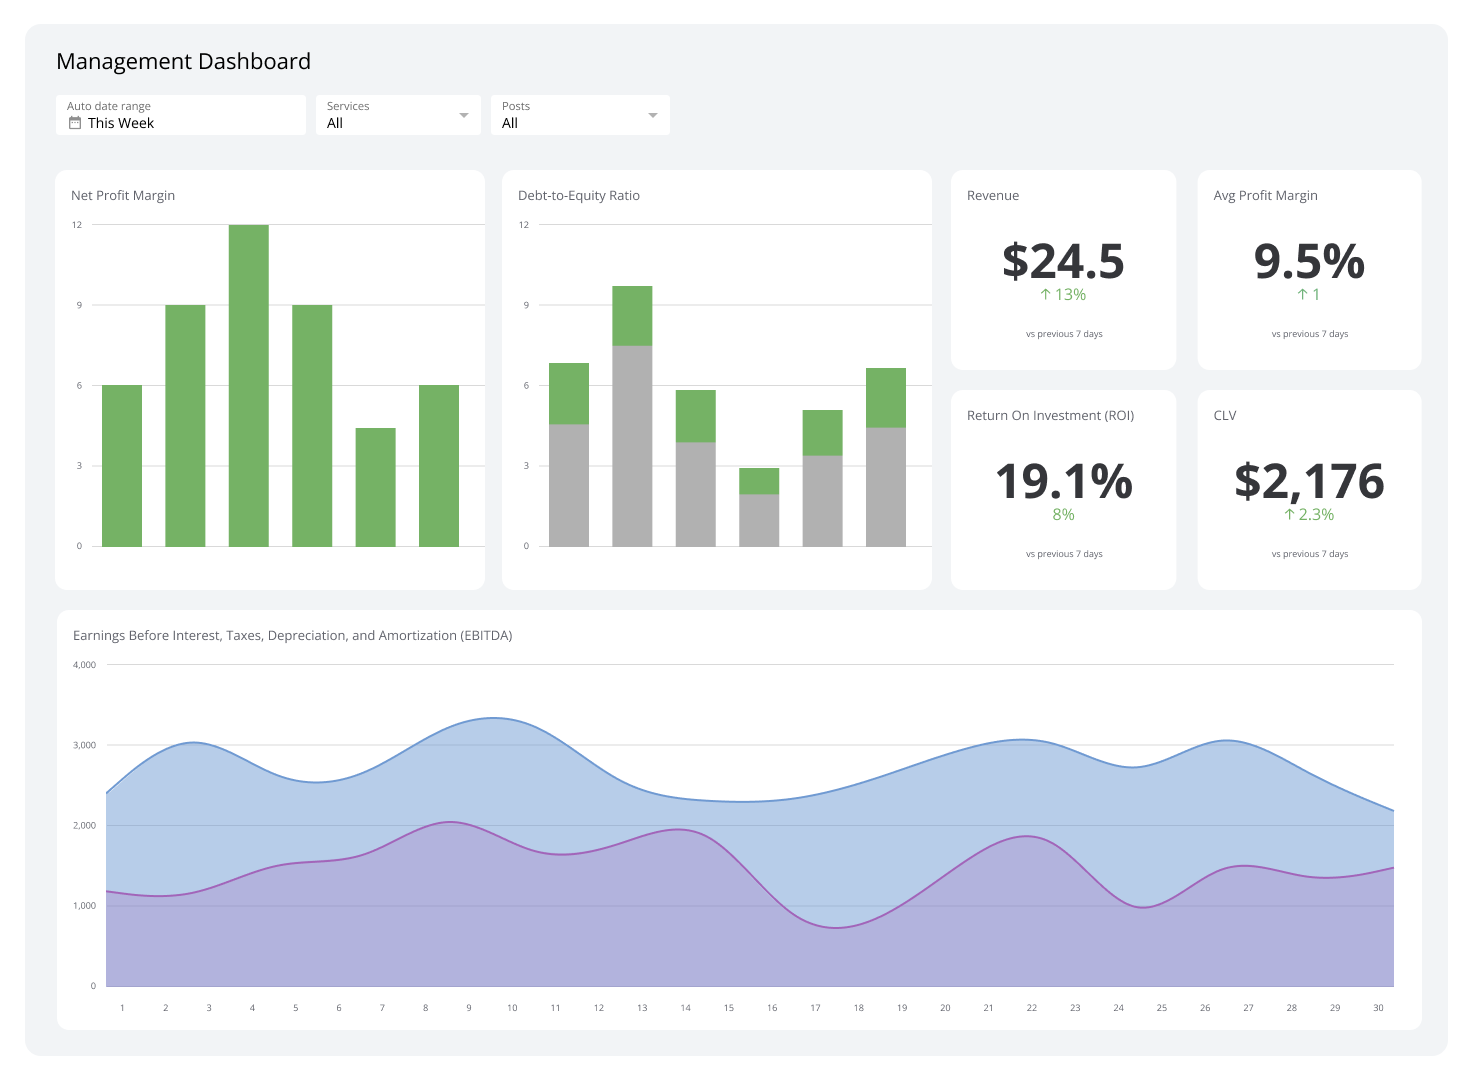
Management Dashboard
A management dashboard gives managers a real-time view of performance across sales, HR, finance, and more — all in one place.
- Executive
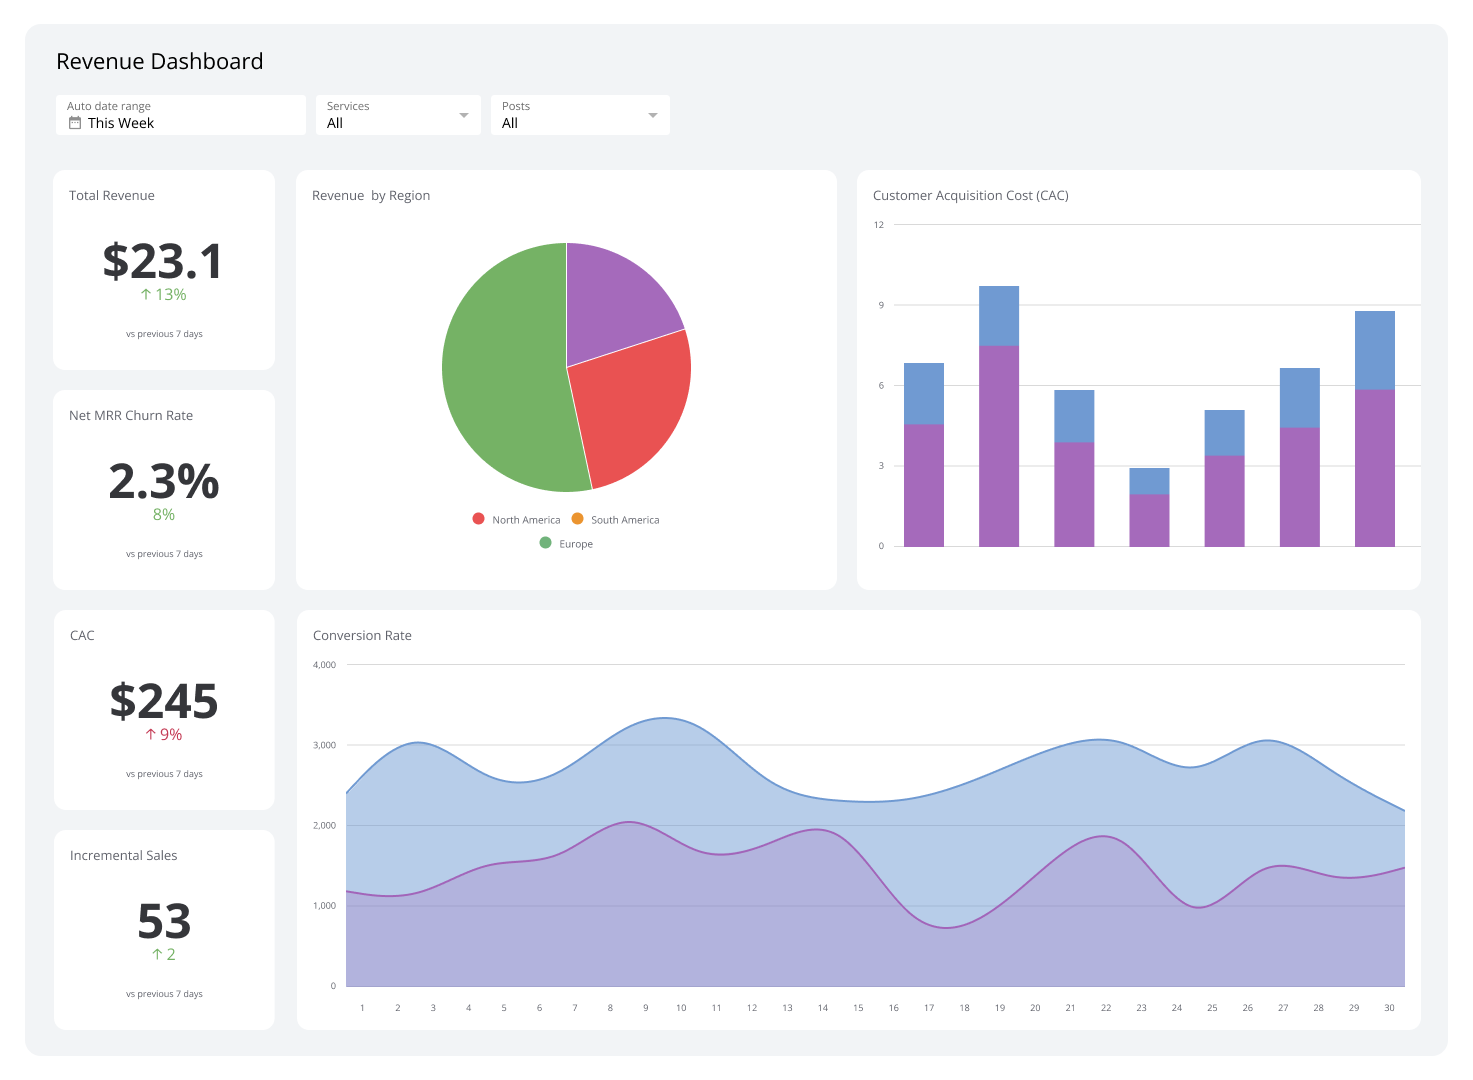
Revenue Dashboard
Track the metrics that matter and drive predictable growth.
- Executive
Cash Flow Dashboard
Timing differences between income and expenditure can influence immediate cash availability. A cash flow dashboard monitors your company's immediate spending power and cash position.
- Executive
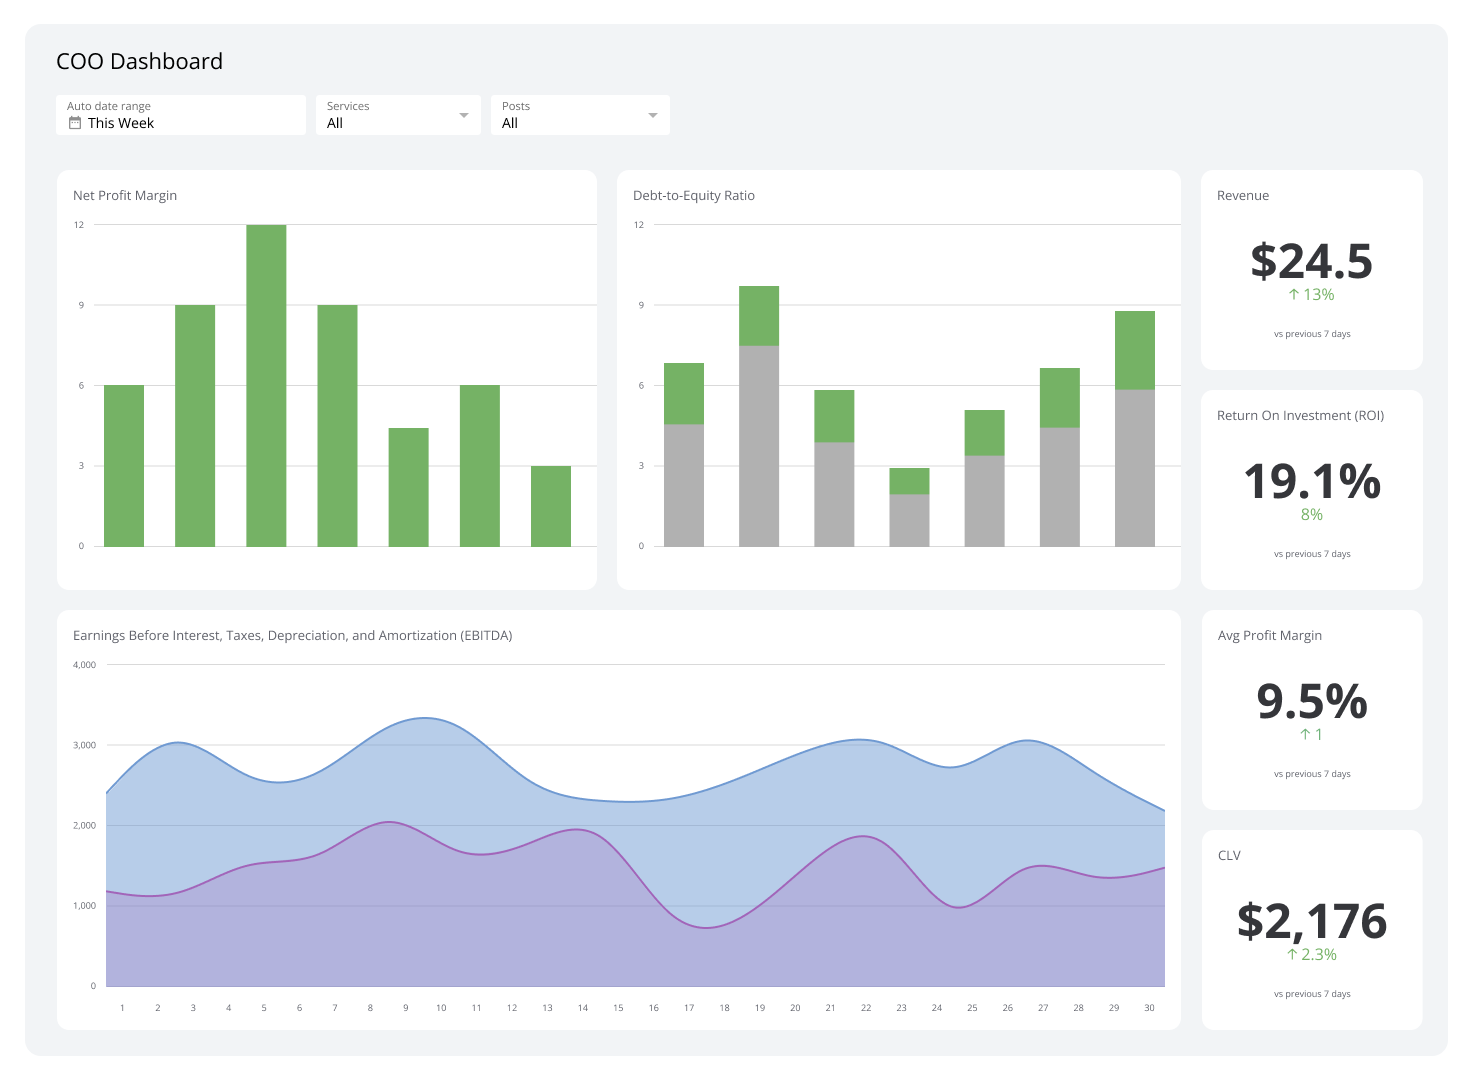
COO Dashboard
See throughput, quality, and cost in one view to act fast.
- Executive
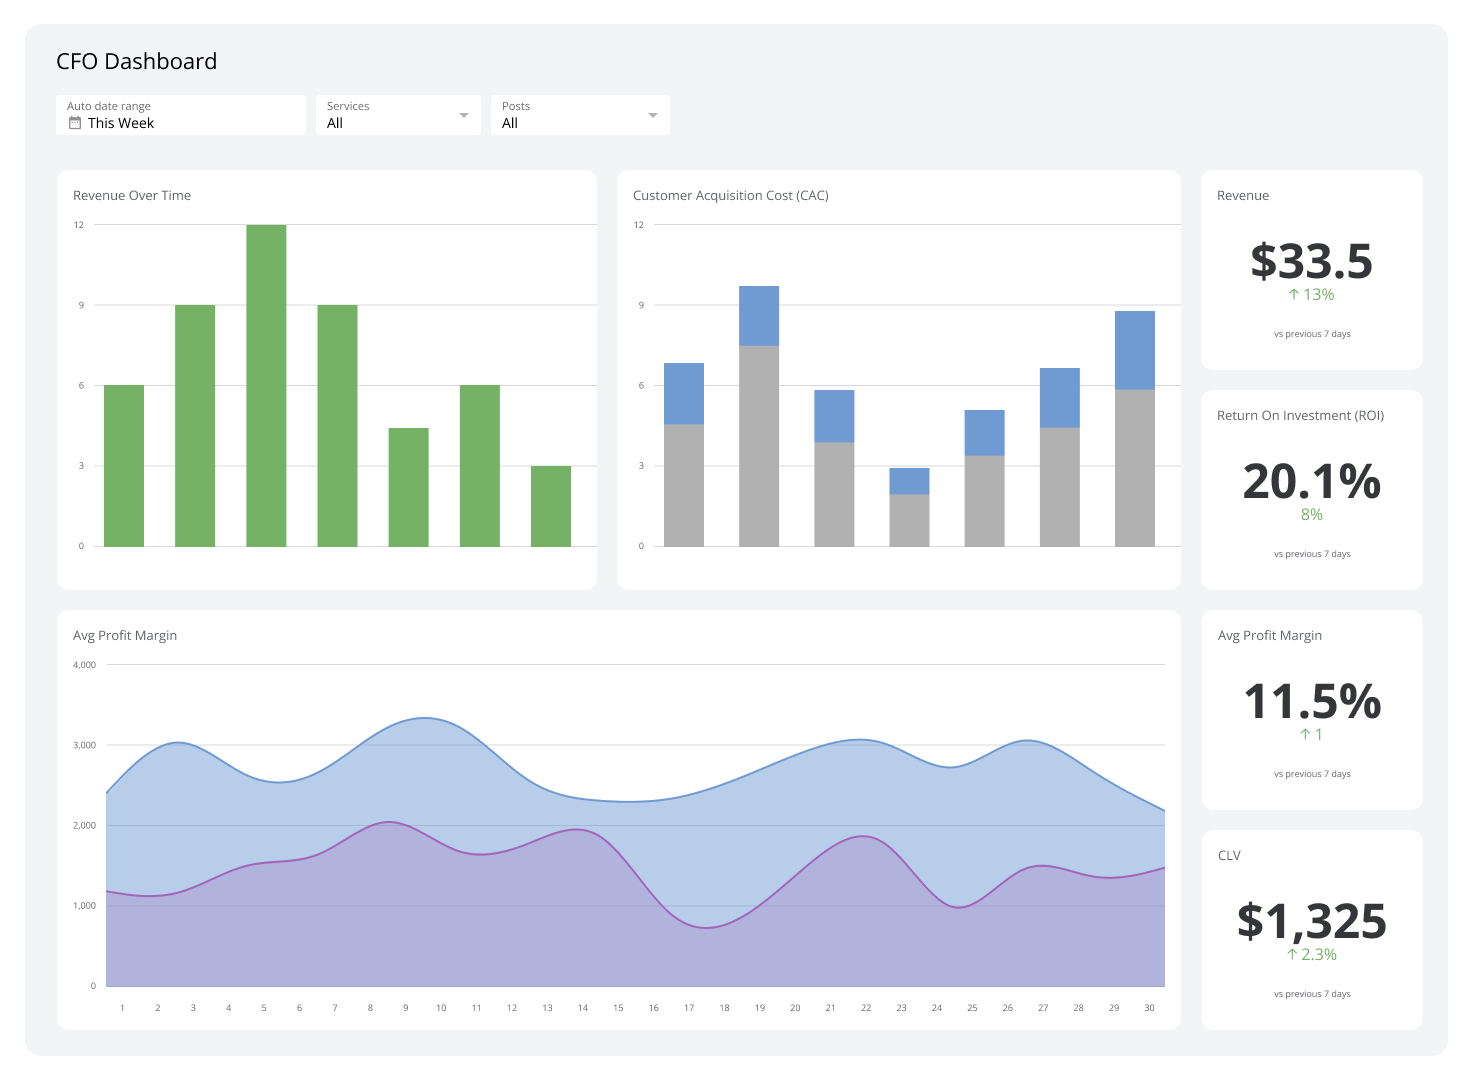
CFO Dashboard
See cash, margins, and runway at a glance to act faster.
- Executive
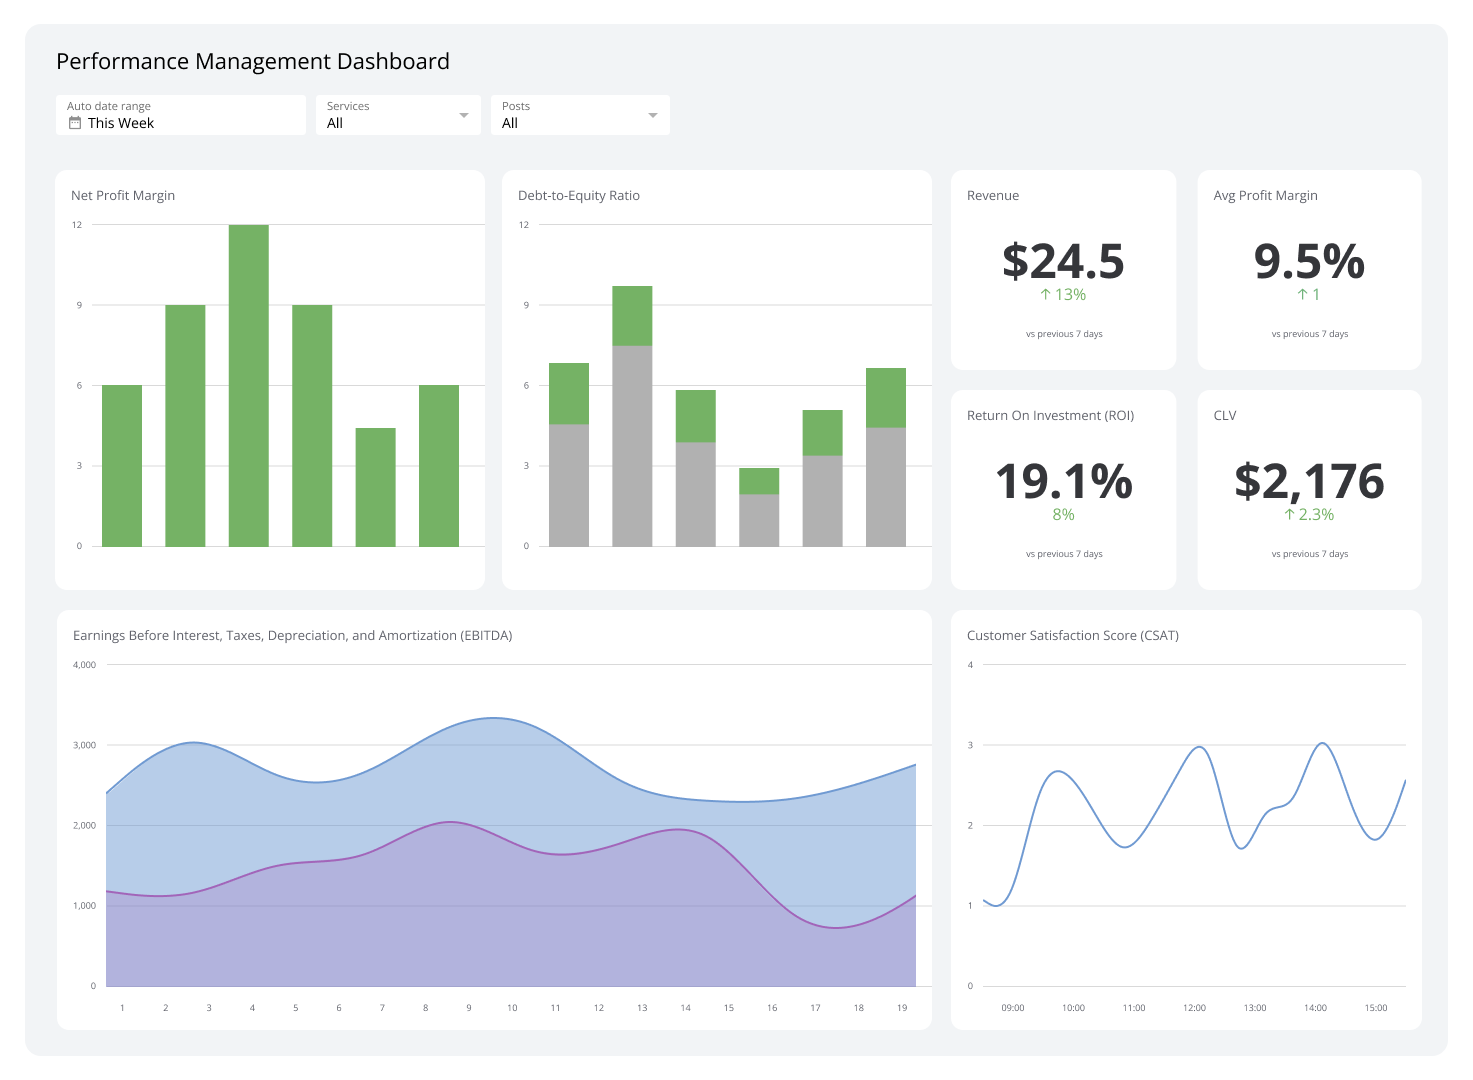
Performance Management Dashboard
Track team goals and productivity to highlight wins and fix gaps.
How do you build an executive dashboard?
Start by talking to the executives who will use it. Each leader tracks different KPIs depending on their function, and a dashboard that doesn't reflect those priorities won't get used.
Here's a straightforward process to follow:
Consult your executive team: Understand what each leader needs to know weekly, monthly, and quarterly
Define your KPIs and key metrics: Agree on the measures that reflect actual performance, not just activity
Choose your dashboard type: Financial dashboard, CEO dashboard, marketing performance dashboard, or a combined strategic view
Sketch a mockup: Map out the layout before building anything
Select your dashboard software: Choose a tool that connects to your existing data sources
Connect to data sources: Pull in live data from finance, sales, marketing, support, and development
Build your visualizations: Keep charts and metrics focused and easy to scan
Gather feedback: Share the draft with your executives before finalizing
Deploy and iterate: Keep refining based on what leaders actually use
What should be on an executive dashboard?
An executive dashboard should show company-level KPIs that give leaders a fast, accurate read on performance. Each executive benefits from a view tailored to their function, but a CEO dashboard typically pulls from every department.
Here's an example for a software company:
| Department | KPIs |
|---|---|
| Finance | Gross Profit Margin, EBITDA, Accounts Receivable, Accounts Payable |
| Sales | Revenue, Opportunity Pipeline |
| Marketing | MQLs, Web Sessions |
| Support | Ticket Volume, Average Resolution Time |
| Development | Lead Time, Cycle Time |
The goal isn't to display everything — it's to show the right things. A cluttered dashboard creates noise; a focused one creates confidence.
Why have an executive dashboard?
The real payoff isn't the dashboard itself — it's what happens when your leadership team stops chasing numbers and starts making calls.
When data lives in disconnected spreadsheets, or when the only way to get a number is to ask someone to pull it, decisions slow down and confidence erodes. An executive dashboard fixes that by keeping the right information in front of the right people, automatically and reliably.
Main benefits of executive dashboards
Saves time: Data from multiple sources is collected and refreshed automatically, so leaders spend less time on data work and more on decisions
Builds trust in the numbers: When everyone sees the same figures from the same source, there's less debate about which version is correct
Improves communication: A shared view of KPIs gives leaders and departments a common language and a shared sense of priority
Supports smarter decisions: With current, reliable data in front of them, executives can act on facts rather than waiting for a report or piecing things together manually
Create custom dashboards for you and your team.
Get started with KlipsHow to keep your dashboard useful
A dashboard that starts strong can lose relevance quickly if it isn't maintained. These habits keep it working:
Keep it focused: Surface the most important KPIs for each leader — too much information slows decisions rather than speeds them up
Verify data accuracy: Reliable decisions depend on reliable data; audit your sources regularly
Review and adjust: Meet with your executives periodically to confirm the dashboard still reflects their current goals
Encourage adoption: Build the dashboard into your team's regular rhythm and ask for feedback — a dashboard only creates value when it's used
Executive dashboards give leaders — whether a CEO, CFO, or department head — a clear, consistent view of what's happening in the business. When you understand each leader's priorities, connect to the right data, and keep the interface focused, you build something that genuinely helps your company move forward.