Cash Flow Dashboard
Timing differences between income and expenditure can influence immediate cash availability. A cash flow dashboard monitors your company's immediate spending power and cash position.

What is a Cash Flow Dashboard?
Cash Flow dashboards provide live insights into your liquid assets and spending capacity. These financial instruments are essential for executives to distinguish between cash flow and revenue streams.
The distinction is necessary because income and expense timing often create discrepancies between reported revenue and available funds. With this tool, you can make informed decisions based on their financial liquidity rather than relying solely on revenue projections.
Examples of Cash Flow Dashboards
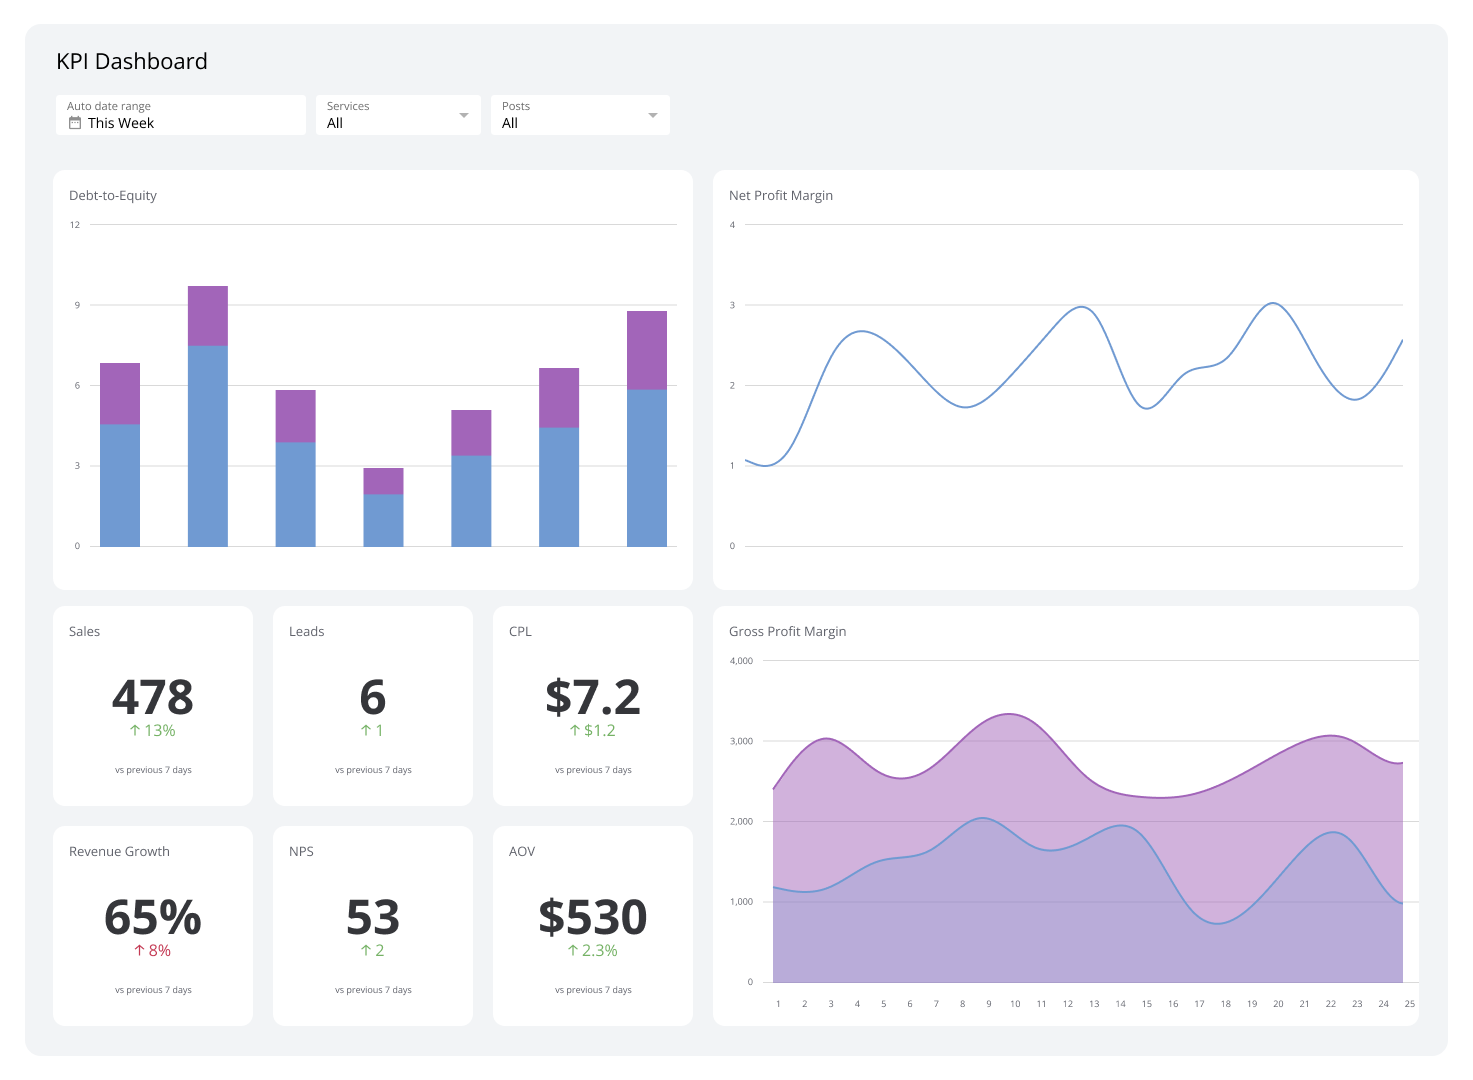
Cash Walkthrough Dashboard
Cash walkthrough dashboards provide a clear, step-by-step view of your cash flow. With color-coded stages, they highlight where money is coming in and going out, making it easy to see how different activities affect your overall finances.
By spotting what impacts money most, you can make better financial decisions and adopt better methods that will lead to continued company growth.
Who’s it for | Chief financial offices (CFOs), financial controllers, treasurers, business owners, financial analysts, c-level executives |
How often it's needed | Monthly, quarterly, yearly |
Covered KPIs | Opening cash balance, cash inflows, cash outflows, net cash flow, closing cash balance, cash flow by category, cash conversion cycle (CCC), working capital, free cash flow, cash flow forecast accuracy |
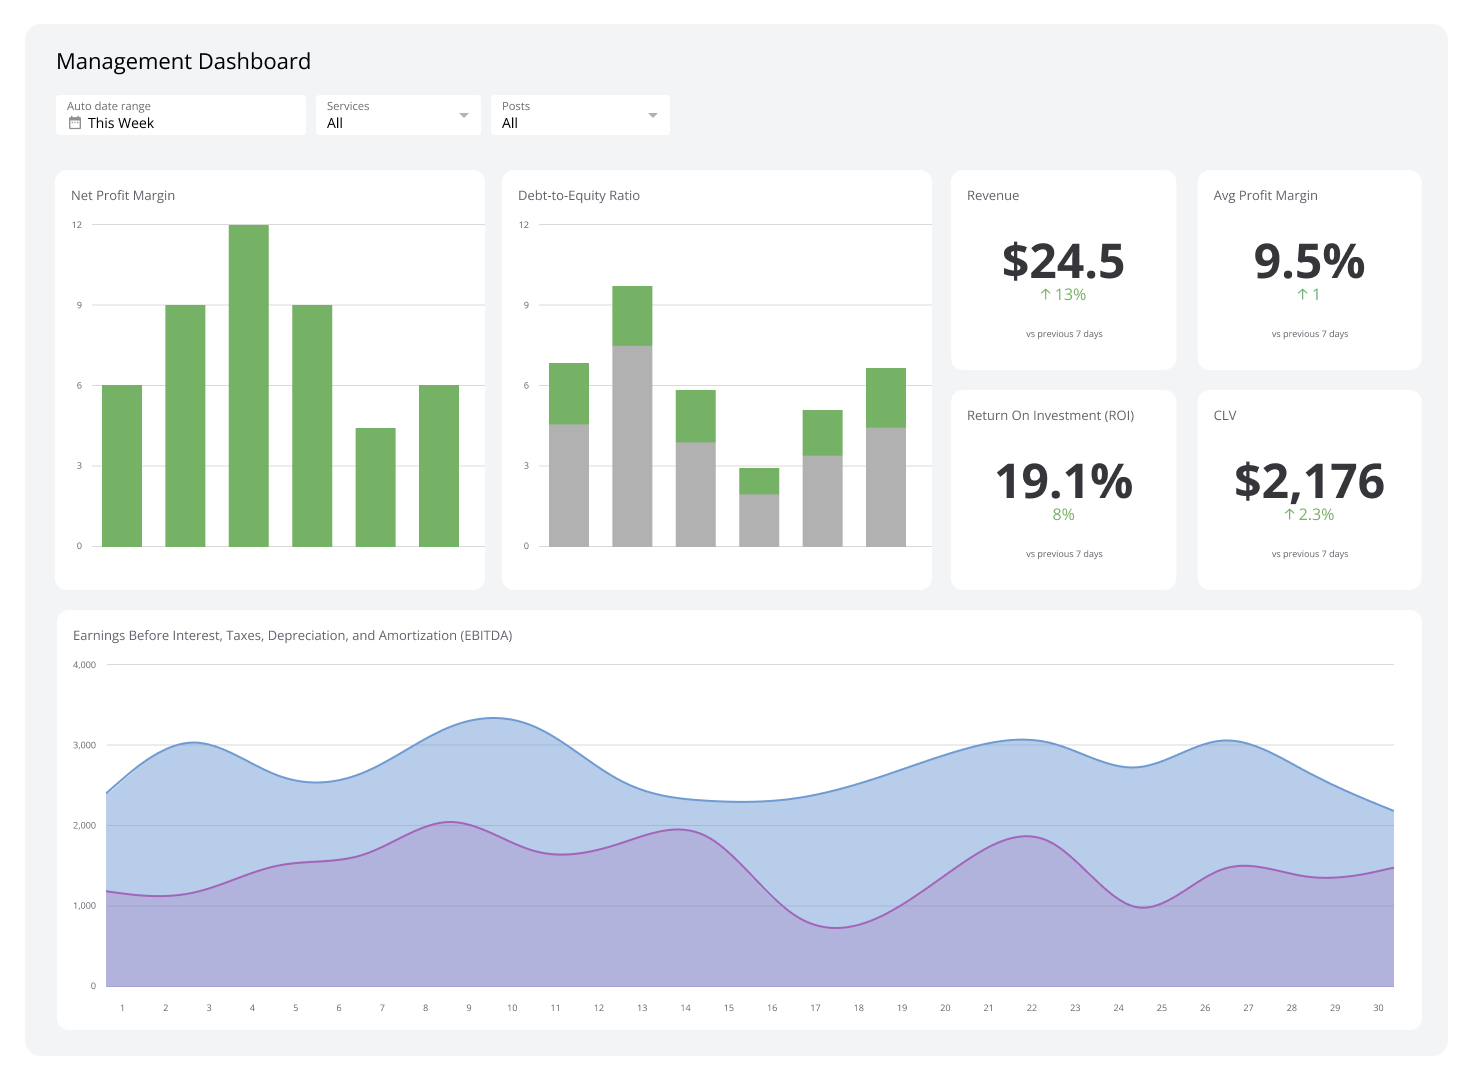
Variance and Actual vs. Forecast Analysis Dashboard
Variance and actual vs. forecast dashboards show critical differences in financial data to leaders. By focusing on discrepancies, these dashboards provide insights into why forecasts might be off, helping to answer questions before they arise. Regular use helps refine financial reporting and predictions over time.
Who’s it for | C-level executives, financial managers, department heads, budget analysts, investors and board members |
How often it's needed | Monthly, quarterly, yearly |
Covered KPIs | Revenue variance, expense variance, profit margin variance, cash flow variance, sales forecast accuracy, budget vs. actual spending, operating expense ratio, return on investment (ROI) variance, earnings before interest, taxes, depreciation, and amortization (EBITDA) variance, working capital variance |
Cash Flow Projections Dashboard
The cash flow projections dashboard offers a look into future financial trends. Using AI-powered analytics, it transforms past data into precise forecasts, helping finance teams plan expenses more effectively and streamline operations. This proactive approach to cash flow management empowers you to make decisions for a competitive edge.
Who’s it for | CFOs, finance directors, financial planners, financial analysts, treasury managers, business unit leaders, executives, board members, investors, stakeholders |
How often it's needed | Monthly, quarterly, yearly |
Covered KPIs | Projected cash inflows, projected cash outflows, net cash flow forecast, cash balance projections, projected burn rate, forecasted cash runaway, projected revenue growth, anticipated expense trends, working capital forecast, liquidity ratio projections |
Cash Inflow from Sales Dashboard
The cash inflow from sales dashboard clearly shows revenue from sales and its impact on cash flow. It highlights key sales metrics to pinpoint areas for improvement in processes and collections. The dashboard supports planning through revenue analysis and forecasting, which can help drive sustainable business growth.
Who’s it for | Sales managers, CFOs, CEOs, finance directors, business analysts, accounts receivable teams |
How often it's needed | Daily, weekly, monthly, quarterly |
Covered KPIs | Total sales revenue, sales growth rate, average order value (AOV), sales by product/service, sales by region, customer acquisition cost (CAC), customer lifetime value, accounts receivable turnover, DSO, cash conversion cycle |
Cash Inflow from Investments Dashboard
A cash inflow from investments dashboard outlines revenue made from all your business’ investment activities. It summarizes incoming money from diverse assets and investments while tracking both realized and unrealized gains from sales. This enables you to assess the effectiveness of your investment strategies, allowing you to make informed decisions that promote business growth and maximize returns.
Who’s it for | CEOs, CFOs, investment managers, financial analysts, board members, shareholders |
How often it's needed | Monthly, quarterly, yearly |
Covered KPIs | Total investment revenue, return on investment (ROI), realized gains/losses, unrealized gains/losses, dividend income, interest income, asset allocation percentages, investment performance by category, cash flow from investments, investment portfolio growth rate |
Total Actual and Forecast Available Liquidity Dashboard
Total actual and forecast available liquidity dashboards manage complex financial situations by combining external and internal liquidity sources. They provide a general illustration of available funds and future projections. During crises, companies rely on these reserves to strengthen financial security.
Who’s it for | CFOs, finance directors, risk management professionals, c-level executives, board members |
How often it's needed | Daily, weekly, monthly |
Covered KPIs | Current ratio, quick ratio, CCC, days sales outstanding (DSO), days payable outstanding (DPO), available credit lines, undrawn revolving credit facilities, short-term investment maturities, forecasted operating cash flow, liquidity coverage ratio, net working capital, free cash flow, debt maturity profile, net burn rate, liquidity stress test results |
Net Debt and Covenants Dashboard
A net debt and covenants dashboard can monitor how changes in monetary flow affect debt levels and financial flexibility. In addition, they track declining earnings, which can further constrain a company's options.
Who’s it for | C-level executives, shareholders, investors, creditors, lenders, financial analysts |
How often it's needed | Monthly, quarterly |
Covered KPIs | Net debt, debt-to-EBITDA ratio, interest coverage ratio, current ratio, debt service coverage ratio, free cash flow, leverage ratio, liquidity ratio, covenant compliance metrics, cash flow trends |
Consolidated Actual and Forecast Cash Positions Dashboard
Consolidated actual and forecast cash positions dashboards provide real-time visibility of your company’s actual and forecast cash levels. This consolidated view, which incorporates data from various business units and bank accounts, serves as the cornerstone for all cash reporting.
Who’s it for | Treasury teams, finance executives, CFOs, finance controllers, cash managers, board of directors |
How often it's needed | Daily, weekly, monthly |
Covered KPIs | Current cash balance, forecasted cash balance, net cash flow, cash conversion cycle, working capital, DSO, DPO, currency exposure, liquidity ratios, cash flow variance |
Finance Dashboard
The finance dashboard monitors your company’s key financial indicators, providing insights into company health and expenditure patterns. It tracks debtor status to mitigate risks from overdue invoices and includes exchange rates for international business decisions.
Who’s it for | CFOs, finance directors, treasury managers, financial controllers, accounting teams, business unit leaders, c-level executives, board members |
How often it's needed | Daily, weekly, monthly, quarterly |
Covered KPIs | Total cash in bank, burn rate, cash runaway, expense breakdown by type, debtor status, exchange rates against US Dollar, month-to-month cash flow changes, liquidity ratios, accounts receivable turnover, working capital |
Expense Management Dashboard
An expense management dashboard offers a view of company spending across various categories, enabling strategic cost optimization through detailed expense breakdowns. The dashboard simplifies trend analysis, budget monitoring, and performance comparisons.
Also, it supports effective financial management and planning by aligning current expenses with budgetary projections.
Who’s it for | CFOs, finance managers, department heads, budget analysts, procurement managers, expense auditors |
How often it's needed | Daily, weekly, monthly, quarterly |
Covered KPIs | Total expenses, expenses by category, expense-to-revenue ratio, budget variance, cost per employee, travel and entertainment expenses, operating expense ratio, expense growth rate, ROI for major expenses, compliance rate for expense policies |
Manage your company cash flow better with Klipfolio
Cash Flow dashboards provide real-time insights into a company's liquid assets and spending capacity. They help you make informed decisions based on actual financial liquidity rather than revenue projections.
Klipfolio offers customizable dashboards that provide real-time financial insights, enabling efficient monitoring of critical metrics and progress tracking. Identify areas for improvement quickly and enhance your financial management.
Begin your free trial now to experience the benefits firsthand!
Watch: Cash Flow Dashboard Overview
Related Dashboards
View all dashboards