Revenue Dashboard
Revenue dashboards compile all essential financial data into one easily understandable view, providing a clear snapshot of a business’s health and performance.
Track all your Revenue KPIs in one place
Sign up for free and start making decisions for your business with confidence.
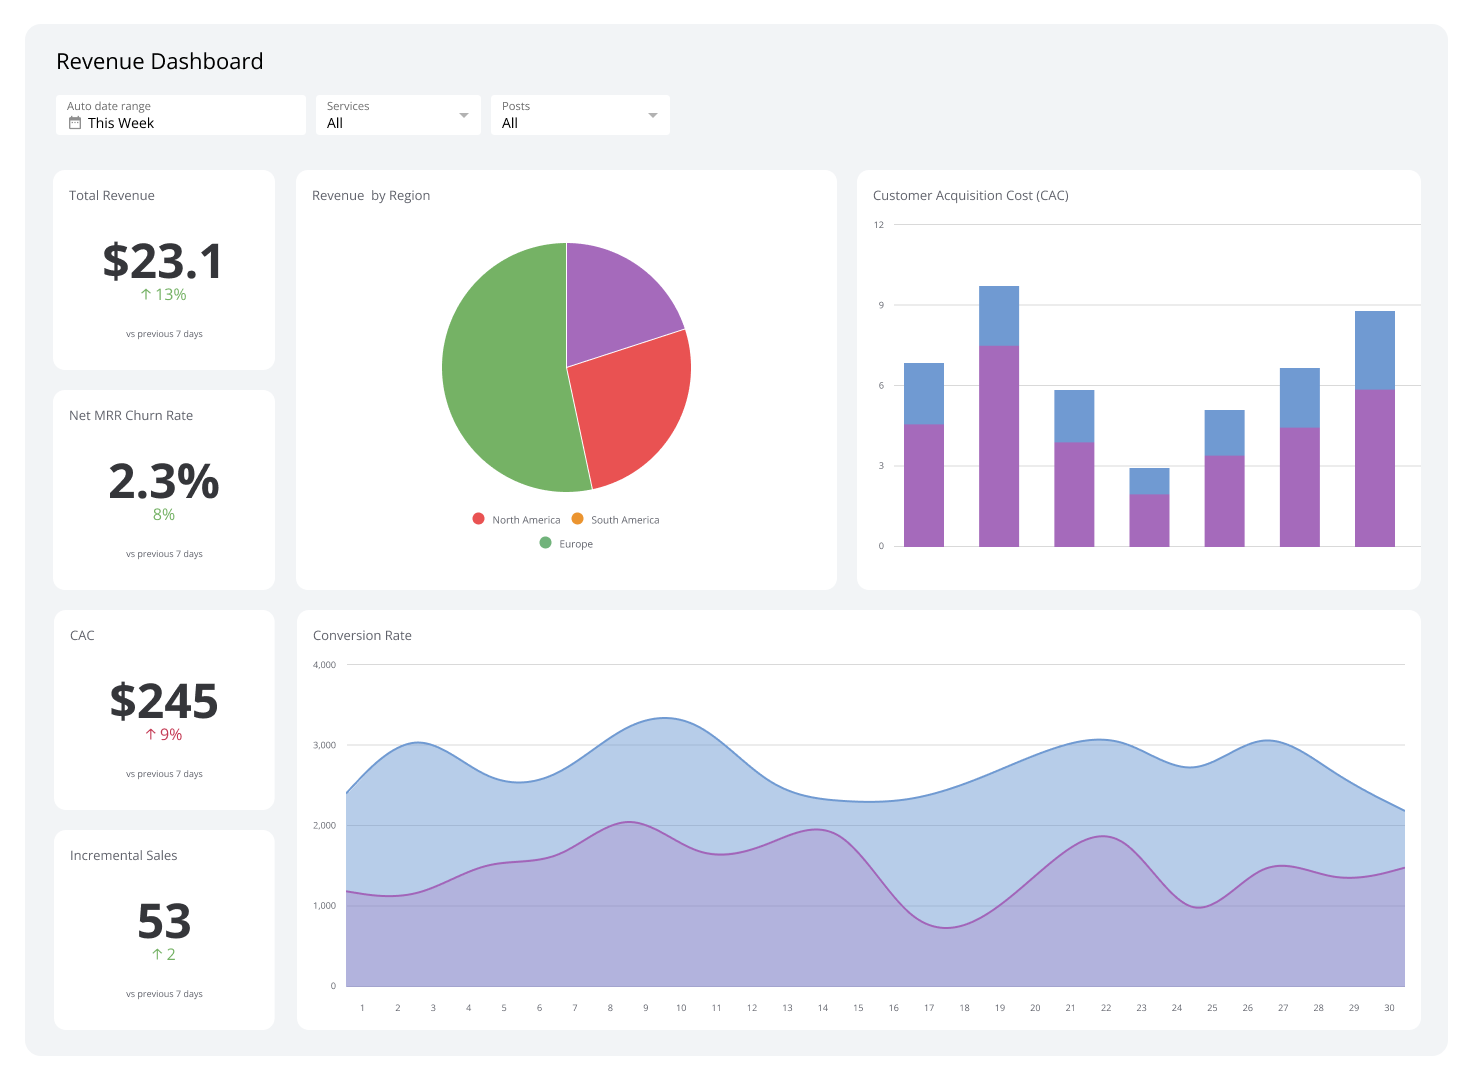
Revenue dashboards compile all essential financial data into one easily understandable view, providing a clear snapshot of a business’s health and performance. By centralizing information on sales, expenses, profit margins, and growth trends, these dashboards eliminate the need to juggle multiple reports and spreadsheets.
What is a Revenue Dashboard?
A revenue dashboard gives business owners clear insights into important numbers like sales growth, conversion rates, how much it costs to acquire new customers, average income per user, and overall profitability. By presenting complex info in an easily digestible format, revenue dashboards let business owners identify trends, spot opportunities, and make calculated judgments to optimize strategies to drive profitable growth.
Examples of Revenue Dashboards
Sales Performance Dashboard
A sales performance dashboard gives managers a 360° panorama of their sales department’s momentum. it’s handy for monitoring advancement toward income targets as it shows a complete picture of the revenue stream. Viewing it will provide valuable insights regarding sales, average revenue per user (ARPU), revenue evolution, customer acquisition costs (CAC), and customer lifetime values (CLV).
Who’s it for | Sales managers |
How often it’s needed | Daily for real-time decision-making or weekly monthly to track longer-term trends |
Covered KPIs | Sales, ARPU, revenue evolution, customer acquisition costs (CAC), CLV |
Sales Manager Dashboard
Sales manager dashboards highlight team output and inform managers about each member's performance. The data they provide can be used to create average sale value benchmarks and track the progression toward overall team goals.
In addition, they often incorporate real-time data on conversion rates, which lets managers make timely decisions on coaching and strategy adjustments.
Who’s it for | Sales managers |
How often it’s needed | Daily to weekly |
Covered KPIs |
Sales Engagement Dashboard
A sales engagement dashboard monitors customer engagement, conversion success, and outbound metrics. It helps entrepreneurs examine their outreach campaigns, supplying the necessary information to make data-driven choices that propel them upward.
Who’s it for | Sales teams, sales leaders |
How often it’s needed | Daily to weekly |
Covered KPIs | Sent emails, click to open rate, top representatives per open rate, lead won rate, new leads, lead drivers |
Sales Leaderboard
Tracking your team's sales can take time and effort. Sales leaderboards make this easy by compiling all appropriate info into one place. This tool promotes friendly competition and aids you in monitoring progression toward your goals. More importantly, it identifies who’s falling behind or excelling at their tasks.
Who’s it for | Sales managers, sales representatives |
How often it’s needed | Hourly, daily, weekly, monthly |
Covered KPIs | New customers, demos, new monthly recurring revenue (MRR), newly-acquired accounts, retention rate, onboarding calls per sales representative |
Conversion Dashboard
A conversion dashboard offers a glimpse at the individual stages of a given sale cycle. It showcases the lead-to-opportunity ratio and opportunity-to-win ratio. With this data, you can determine which aspects of your sales process are improving and which need to be improved.
Who’s it for | Sales managers |
How often it’s needed | Weekly to monthly |
Covered KPIs | Lead-to-opportunity ratio, opportunity-to-win ratio, lead conversion rate |
Sales Productivity Dashboard
Executives must have a top-level view of their company’s sales pipeline. A sales productivity dashboard allows you to zoom in and identify what to focus on to strategically encourage revenue and increase the effectiveness of your sales approach.
Who’s it for | Sales executives |
How often it’s needed | Weekly to monthly |
Covered KPIs | Top representatives, closed income by region, regional quota percentages, pipeline by regions |
Win-loss Dashboard
Individual and team win rates constantly change. Win-loss dashboards show how they change over time, simplifying pinpointing performance trends to help business owners construct the appropriate plans to increase wins or cut down on financial losses.
Who’s it for | Sales teams |
How often it’s needed | Monthly |
Covered KPIs | Opportunities gained and lost, win rate, loss rate |
Sales Activities Dashboard
A sales activities dashboard lets you observe your team’s sales activities. It displays the number of calls made, the length of those calls, and the number of marketing emails sent. The data this dashboard provides simplifies analyzing the effectiveness of outreach endeavors.
Who’s it for | Sales teams, sales managers |
How often it’s needed | Weekly to monthly |
Covered KPIs | Funnel conversion rate, income per day, dial per hour |
Sales Cycle Length Dashboard
Adopting an efficient sales cycle is imperative to any business's success. Sales cycle length dashboards are helpful because they help managers better understand sales cycle length, allowing them to produce informed decisions that improve overall workplace productivity.
Who’s it for | Sales managers |
How often it’s needed | Monthly |
Covered KPIs |
Time-tracking Dashboard
Time-tracking dashboards give sales managers a detailed outline of how each team member spends their time. With it, productivity bottlenecks can swiftly be identified.
Who’s it for | Sales managers |
How often it’s needed | Daily |
Covered KPIs | Total hours tracked, billable hours, clients, tasks, time spent on each project |
MRR Breakdown Dashboard
An MRR breakdown dashboard breaks down your monthly recurring revenue into several components. Its information informs businesses about the dynamics that affect their income, enabling entrepreneurs to make calculated choices that foster growth and stability.
Who’s it for | Sales teams, sales managers |
How often it’s needed | Monthly |
Covered KPIs | Net monthly recurring revenue, net MRR churn rate, MRR expansion rate, lost MRR from cancelations |
Sales Opportunity Dashboard
A sales opportunity dashboard highlights future growth opportunities in your sales pipeline and points you to the best opportunities. This dashboard employs comprehensive sales data to organize your business opportunities by stage, region, and average value per purchase.
Who’s it for | Sales managers |
How often it’s needed | Weekly to monthly |
Covered KPIs | Bookings, sales opportunities, average value per purchase, regional opportunity breakdown, units per transaction |
Deal Performance Dashboard
A deal performance dashboard is designed to provide a comprehensive view of the sales pipeline and deal progress, such as when deals are about to close, pipeline changes, expected deal closure dates, and other relevant data.
Who’s it for | Sales teams |
How often it’s needed | Daily, weekly, monthly |
Covered KPIs | Pipeline changes, newly-created deals, sales cycles length |
Sales-by-Region Dashboard
A sales-by-region dashboard helps you see how much money you're making from sales in different locations, like cities and regions, and for different products. It breaks down sales information by individual sales reps and customers, which can help you come up with better strategies to increase your income.
Who’s it for | Sales managers |
How often it’s needed | Daily, weekly, monthly |
Covered KPIs | Product sales, sales by city, sales by region, income by product group |
Sales Product Performance Dashboard
A sales product performance dashboard allows you to clearly visualize the effectiveness of your products and campaigns. It also highlights the products that generate the highest revenue and displays online vs. in-store purchase figures.
Who’s it for | Sales teams |
How often it’s needed | Daily, weekly, monthly |
Covered KPIs | Cost of sold goods (COGS), incremental sales, product performance |
Sales KPI Dashboard
A sales KPI dashboard visualizes essential metrics, such as customer churn rate and income per sales rep, providing a clear performance overview across multiple parameters. It allows you to compare actual sales figures against targets or goals, allowing you to evaluate individual performance and determine who might need additional support or training.
Who’s it for | Sales managers, executives |
How often it’s needed | Daily, weekly, monthly |
Covered KPIs | Income per sales rep, upsell & cross-sell rates, profit margin per representative, customer churn rate |
Sales Pipeline Dashboard
A sales pipeline dashboard provides detailed insight into your pipeline, letting you know where leads are coming from. You can then use this data to make the adjustments necessary to meet quotas and take advantage of opportunities.
Who’s it for | Sales analysts, sales managers, executives |
How often it’s needed | Weekly to monthly |
Covered KPIs | Sales quota attainment, pipeline by the size of the opportunity, pipeline by opportunity stages |
Visualize your sales data with Klipfolio
A revenue dashboard can give you a clear, simple view of important sales data, making it easier to make decisions. Related dashboards such as sales leaderboards, sales engagement reports, and MRR breakdowns can help you monitor the overall performance of your sales teams and find areas in the pipeline to improve on.
Klipfolio is great for making the most of your data. It takes raw information and turns it into customizable dashboards to fit different needs in your business. Get started with a free trial today.
