Sales Dashboards
Use sales dashboards to hit more targets.
Track all your Sales KPIs in one place
Sign up for free and start making decisions for your business with confidence.
What is a Sales Dashboard?
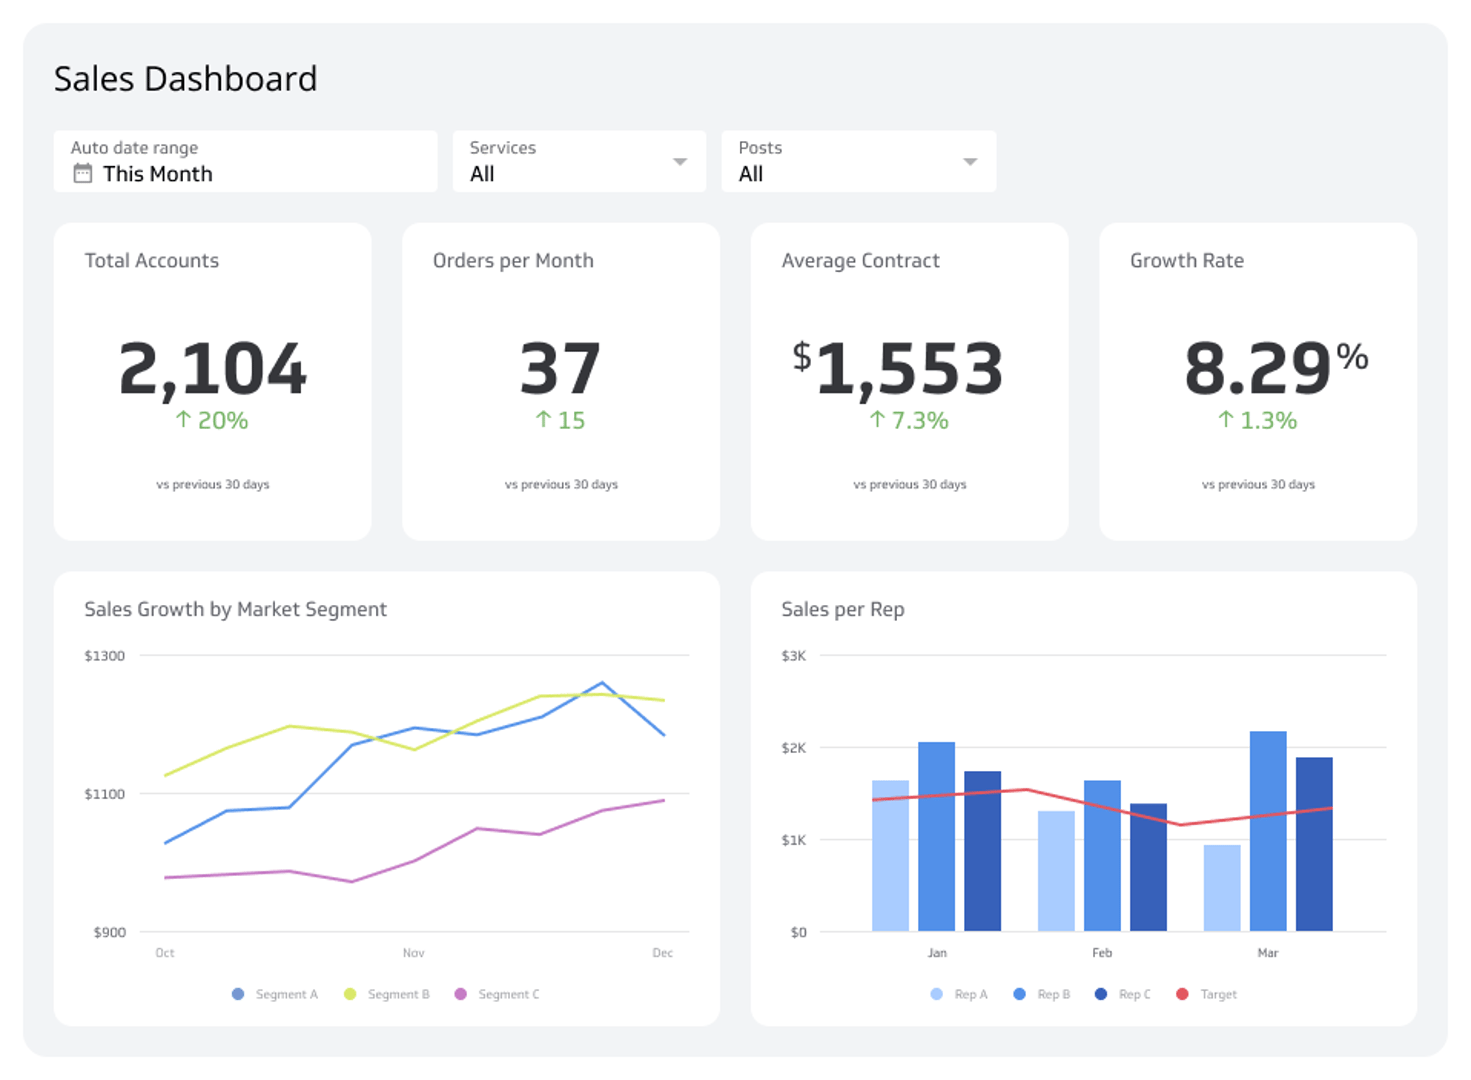
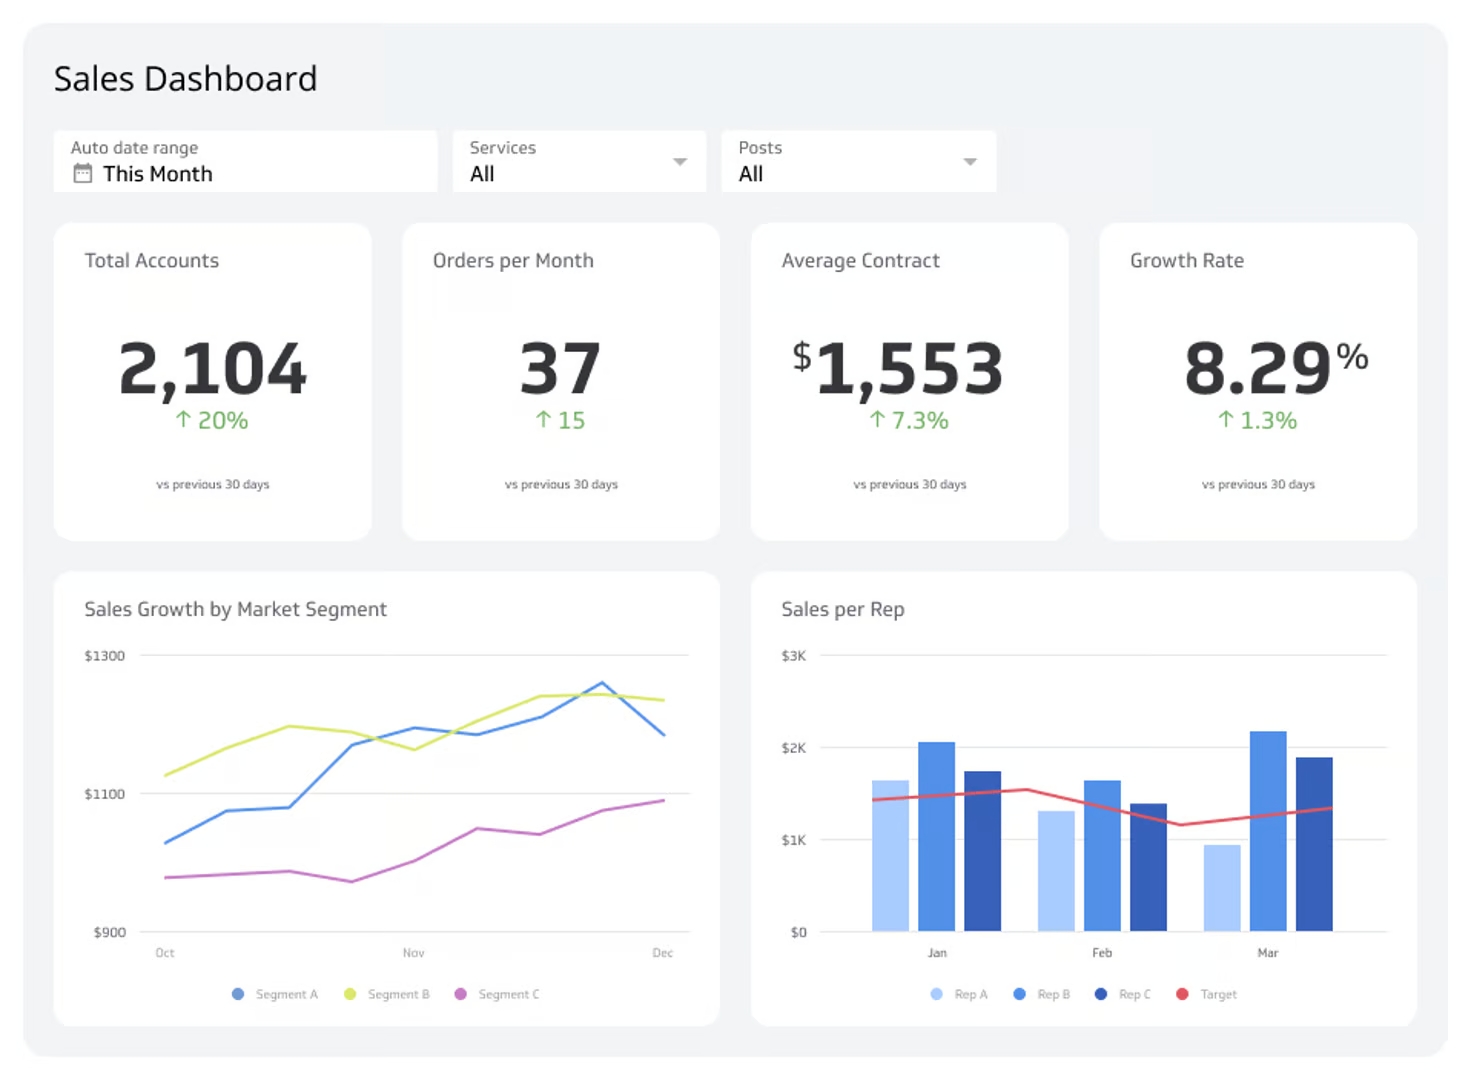
Sales dashboard is a tool designed to provide sales teams with a comprehensive, real-time view of their performance by visually displaying key sales metrics and data.
The dashboard provides an at-a-glance view of your sales team's performance. Sales teams operate in a fast-paced, target-oriented environment. Data-driven sales managers and reps closely monitor their individual and team performance on a daily basis so they can adjust or improve their strategies in real-time.
Related Dashboard Examples
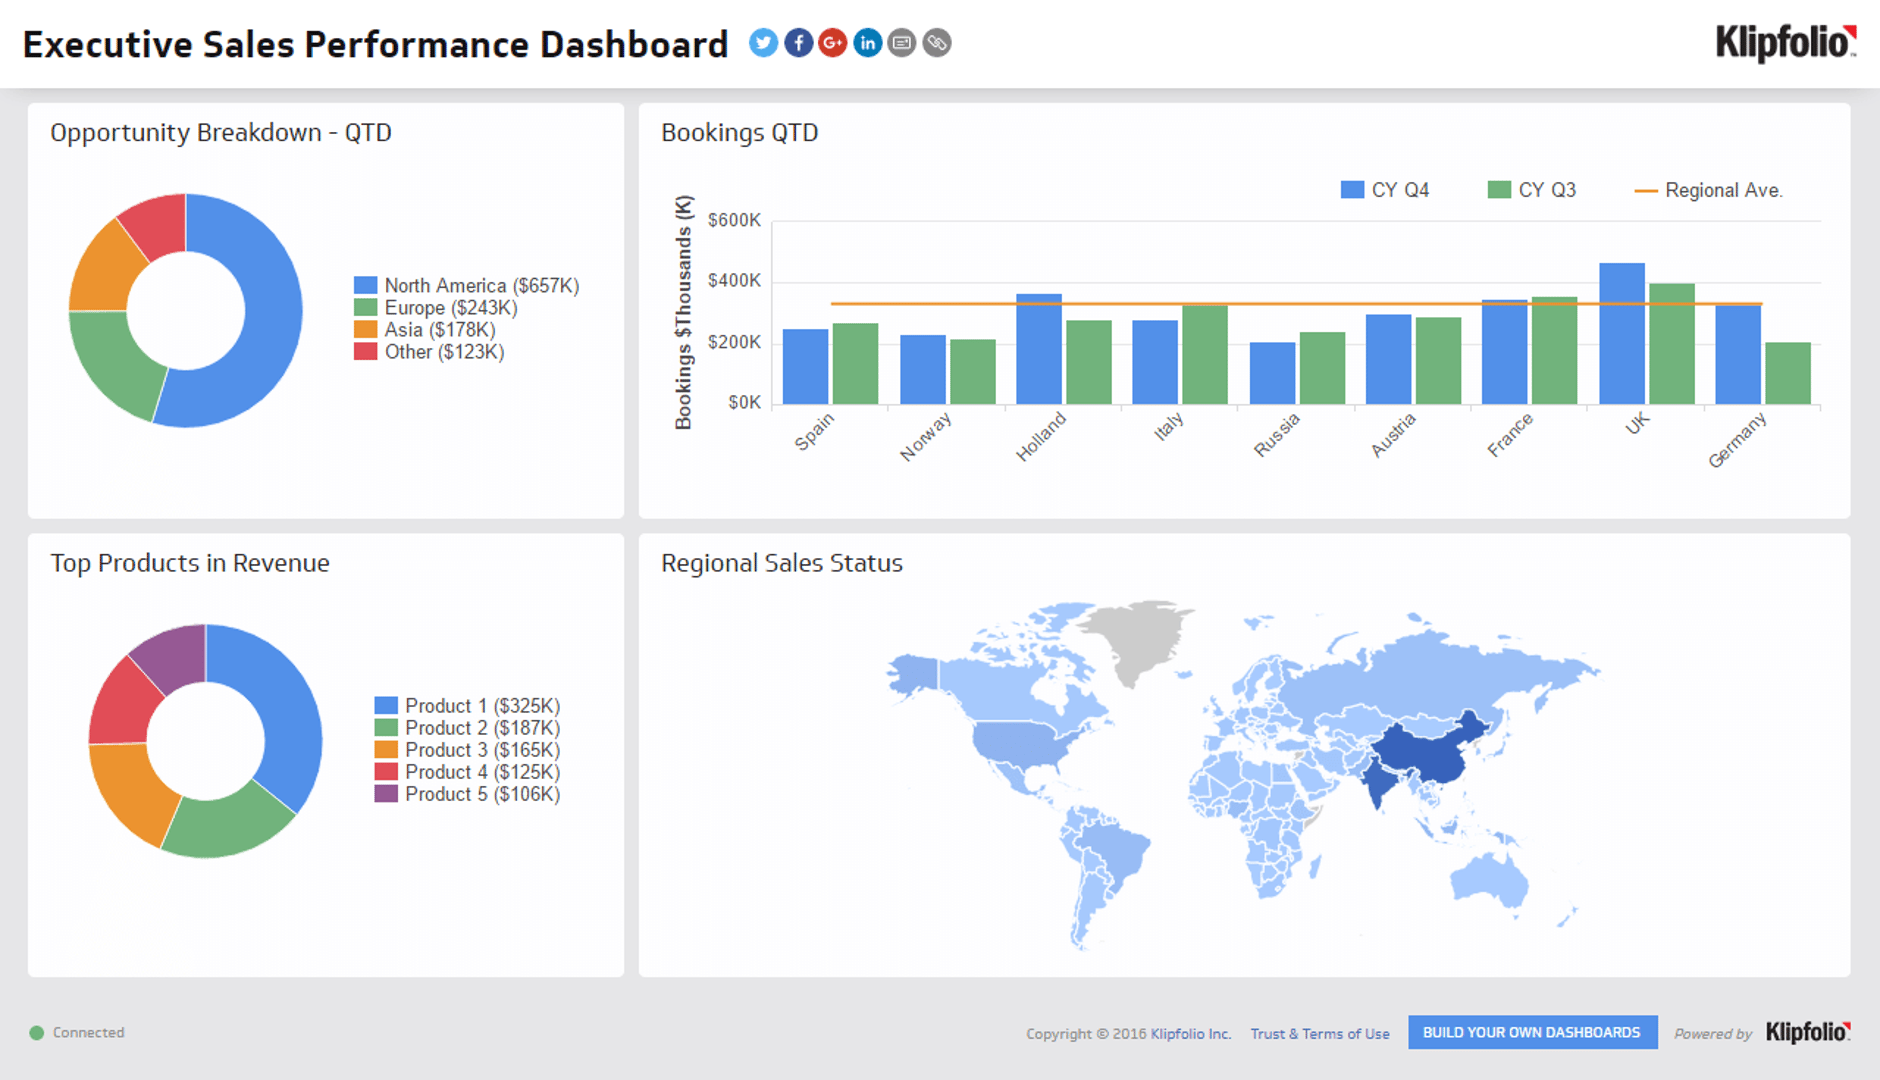
Offer your executive team an easy to read summary of your sales performance.
Sales Performance DashboardSales professionals are hard-wired to pay close attention to the current status of opportunities, leads, and prospects.
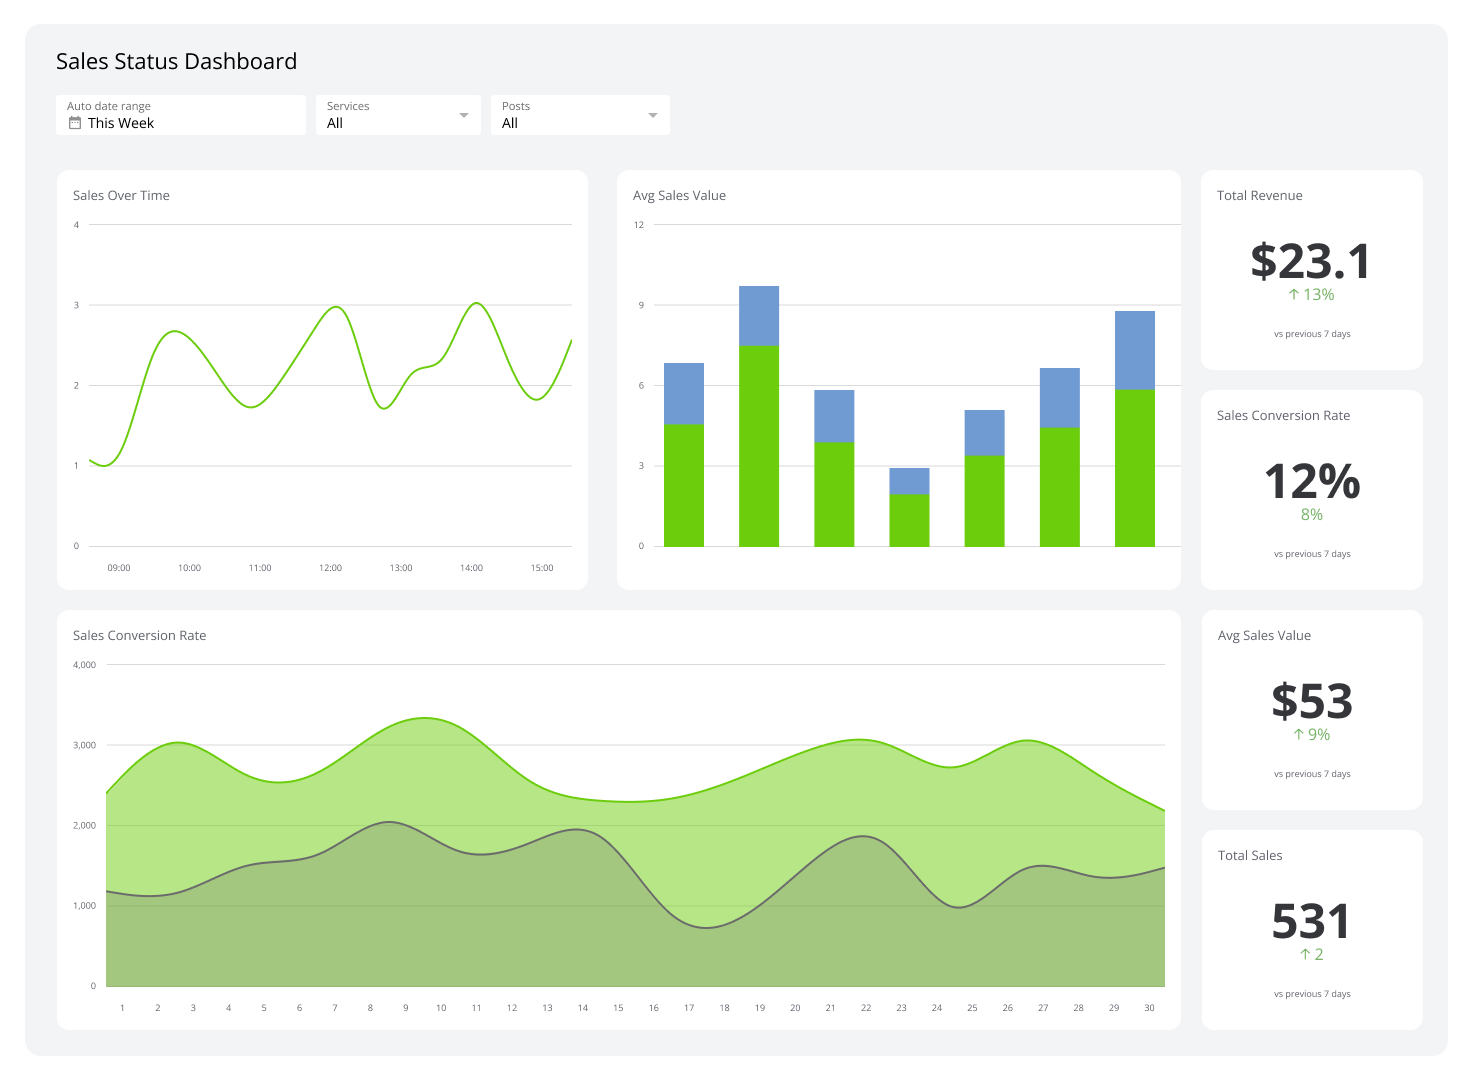
Sales StatusThis sales opportunities dashboard example is designed to show the latest opportunities and sort them according to their stage and value.
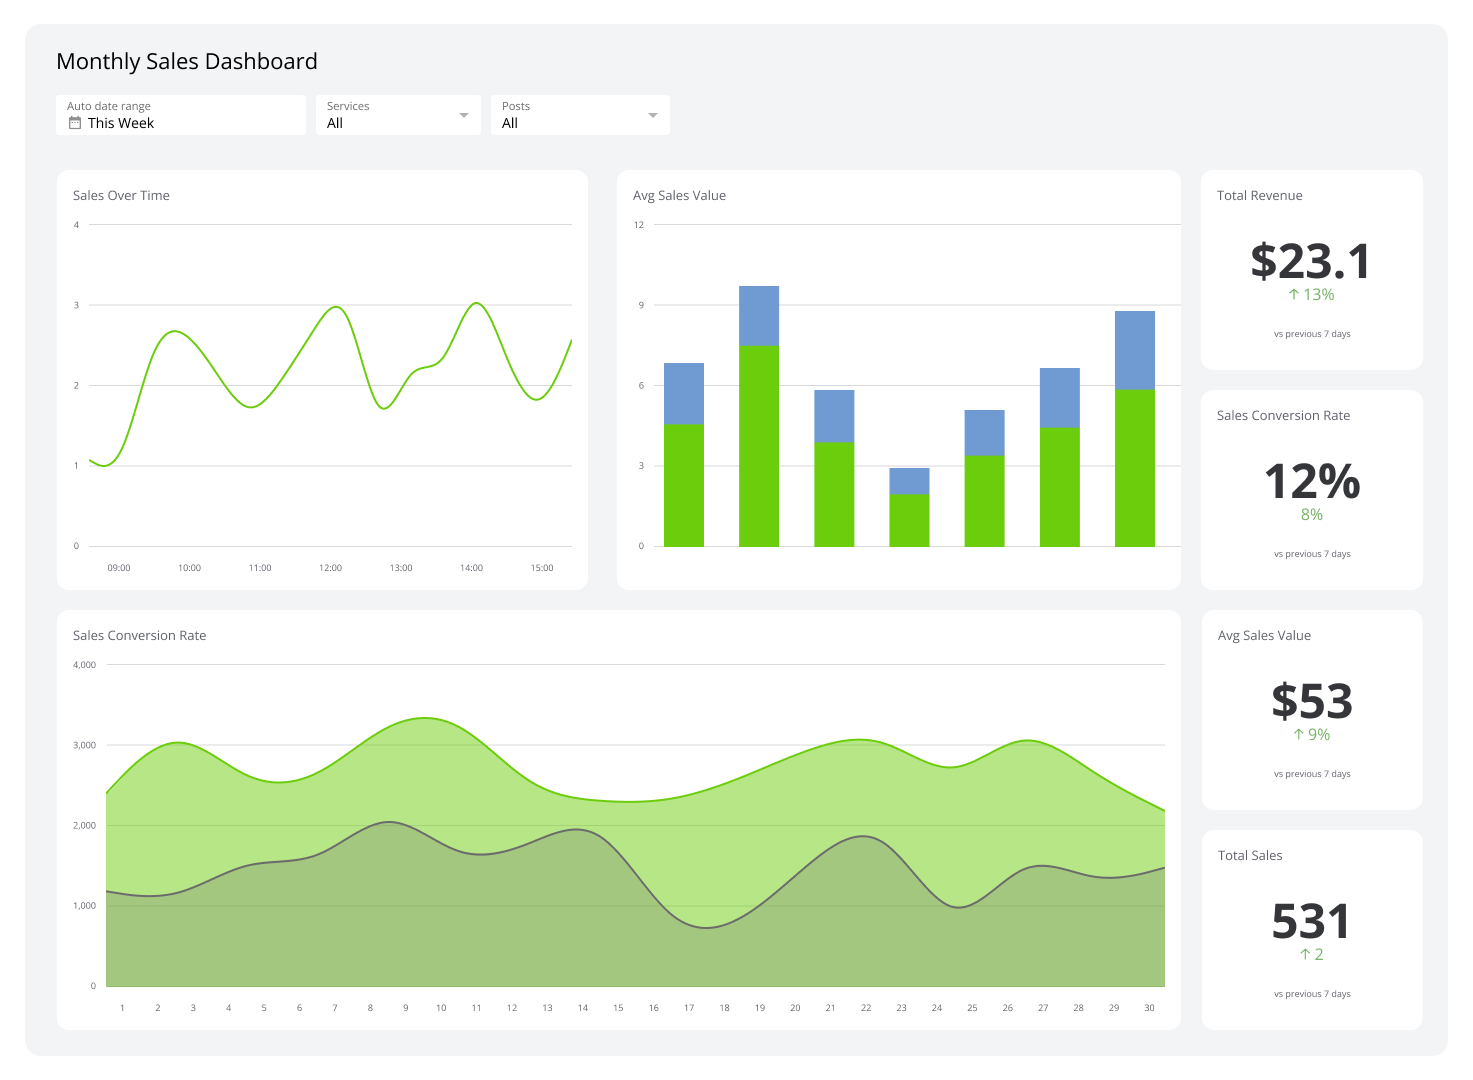
Sales OpportunitiesUse a monthly sales dashboard to report on key sales metrics and KPIs.
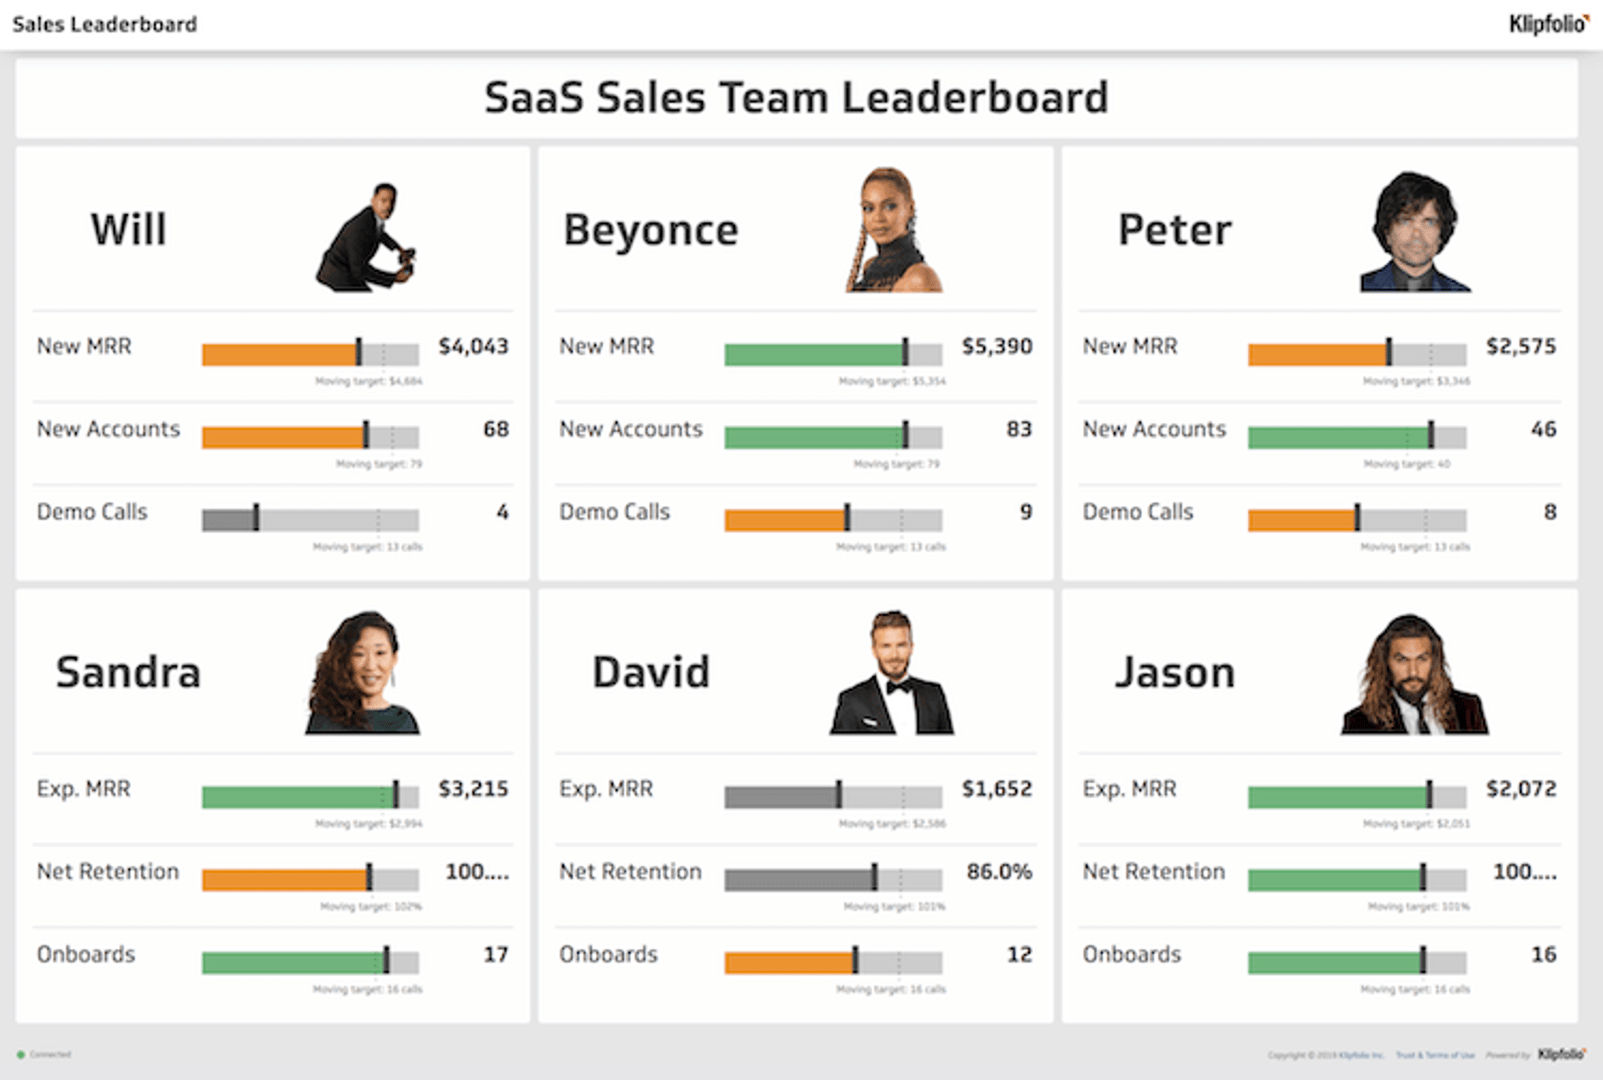
Monthly SalesUse a sales leaderboard to track performance and motivate your sales team to reach targets.
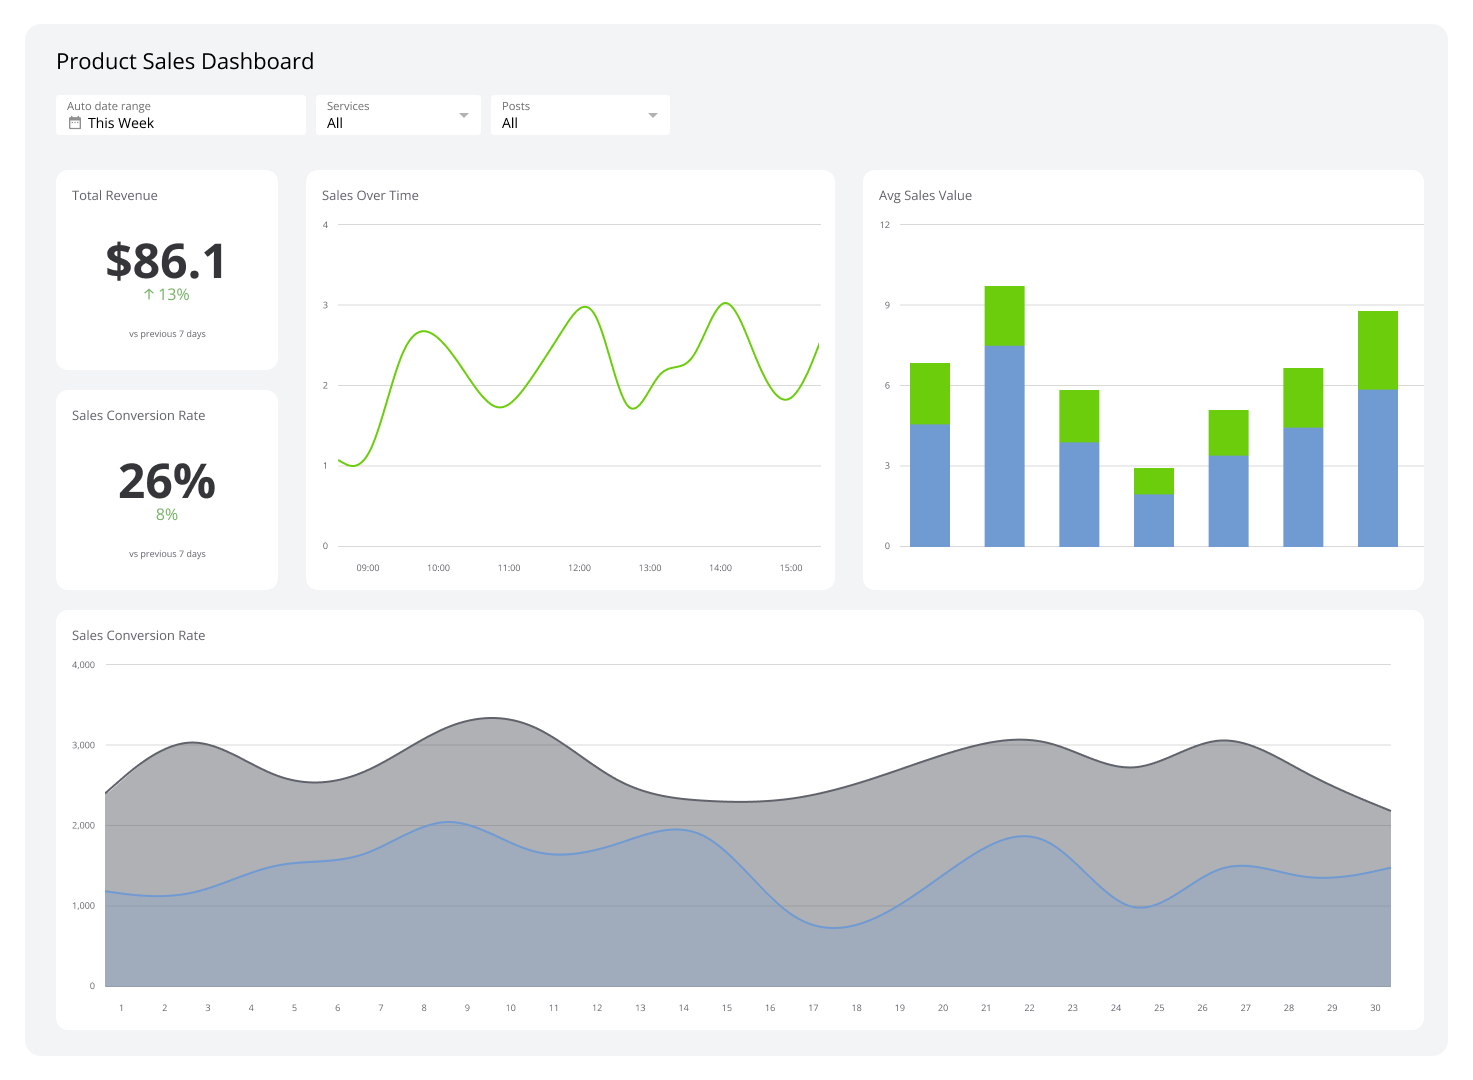
Sales LeaderboardProvides information about the performance of campaigns and products so that your team can make the adjustments needed to meet sales targets.
Product Sales DashboardA sales pipeline dashboard provides a real-time visual representation of your company’s entire sales process.
Sales Pipeline DashboardSales manager dashboards provide a straightforward visual overview of crucial performance indicators for effective sales leadership.
Sales Manager DashboardSales activity dashboards track salespeople's daily tasks, focusing on productivity and pipeline progression.
Sales Activity DashboardSales KPI dashboards provide a detailed view of your company’s revenue performance through critical KPIs. Their deep insights allow you to diversify your revenue and maximize profitability.
Sales KPI Dashboard
Sales dashboards are interactive visual interfaces that collect all your sales data and turn it into graphs, charts, and tables.
What is a Sales Dashboard?
A sales dashboard consolidates data from numerous sources, such as data warehouses, web services, reports, and AI. It then processes this data into key performance indicators (KPIs) presented as interactive visuals such as pie charts and bar graphs.
Examining a sales dashboard helps you understand the numbers behind what is driving your sales activities forward. More importantly, it provides the knowledge necessary to spot issues dragging down sales performance.
For example, it can showcase low customer satisfaction scores, which are a common cause of reduced brand reputation and product sales.
In addition, sales dashboards enable you to construct accurate sales predictions. By analyzing historical sales data, market indicators, and seasonal trends, you can create forecasts for future sales performance.
You can also identify areas of opportunity, such as untapped market segments or geographic regions your business can capitalize upon.
Examples of Sales Dashboards
Sales Lead Dashboard
A sales lead dashboard helps you monitor, track, and analyze lead generation efforts in real time. It often displays metrics such as total leads generated, lead conversion rates, and lead source analysis.
Besides that, the dashboard also monitors metrics such as response time to leads, average time to convert, and lead quality scores. This particular sales dashboard can be beneficial in many ways.
For example, highlighting slow response times, it prompts teams to streamline their follow-up processes. Moreover, by tracking lead conversion rates, the dashboard helps identify high-performing sales strategies that can be replicated across the team.
Who’s it for | Sales teams, sales managers, marketing teams, business development managers, company executives |
How often it's needed | Daily, weekly, monthly |
Covered KPIs | Total leads generated, lead conversion rate, lead source analysis, response time to leads, leads by stage in the sales funnel, lead-to-opportunity ratio, average time to convert leads, cost per lead (CPL), average quality score, lead follow-up rate, marketing campaign performance, abandoned leads, lead velocity |
Sales Pipeline Dashboard
Sales pipeline dashboards provide a live breakdown of your company’s sales pipeline, allowing you to monitor prospects as they move through different stages.
The information these dashboards provide, such as the number of leads, conversion rates, and average time spent in each stage, makes it easy to evaluate the success of your CTAs and spot where potential buyers are encountering roadblocks.
For instance, if many leads drop off at the proposal stage, it may indicate that your proposals lack quality or appeal.
Who’s it for | Sales managers, sales representatives, company executives, marketing teams, operations teams |
How often it's needed | Daily |
Covered KPIs | Number of leads, sales conversion rates, average time spent in each stage, drop-off rates, sales velocity, deal size/average revenue per deal, win rate, sales funnel leakage, lead response time, follow-up activity, quota attainment, customer acquisition cost (CAC), customer lifetime value (CLV), sales forecast accuracy, pipeline value |
Sales Manager Dashboard
Sales manager dashboards are designed to give your sales managers a complete view of all the metrics they need to manage their teams better, including sales revenue, sales growth, and average deal size.
Though the scope of these dashboards can vary by company, product, or service, each variant provides sales managers with insights that help them recognize trends, analyze progress, and make informed sales strategy decisions.
Who’s it for | Sales managers, company executives, sales analysts, revenue operations teams |
How often it's needed | Daily |
Covered KPIs | Total sales revenue, sales growth, average deal size, sales by region, sales by product/service, sales cycle length, opportunity win rate, lead conversion rate, CAC, CLV, sales rep performance, pipeline value, forecast accuracy, customer satisfaction scores |
Forecast Dashboard
A forecast dashboard shows concrete figures that help you anticipate future sales. It achieves this by highlighting market shifts, sales growth, and pipeline value data to calculate predicted business outcomes.
This dashboard also facilitates optimized budget allocation by informing you of potential revenue streams, market opportunities, and pipeline areas requiring investment.
Furthermore, it provides a better understanding of consumer behavior and purchasing patterns. This allows you to offer more tailored product offerings and refine your sales approach. How? You can create improved sales pitches more likely to entice and resonate with customers.
Who’s it for | Company executives, sales managers, financial analysts, revenue operations teams |
How often it's needed | Weekly, monthly, quarterly, yearly |
Covered KPIs | Annual projected revenue, forecast accuracy, pipeline value, sales growth forecast, sales quota attainment, deal size/average revenue per deal, sales cycle length, opportunity win rate, lead conversion rates, market trends, resource allocation, anticipated challenges, budget utilization, operational efficiency |
Sales Growth Dashboard
Using a sales growth dashboard, you can gain an overview of what’s driving your sales forward. This dashboard focuses on growth indicators, showing your business's total revenue and how it achieved this by quarter or year.
It also shows net profit and customer acquisition trends, letting you determine products that outperform others, regions with untapped potential, and seasonal shifts that affect your sales cycle.
With such insights, you can establish marketing strategies (such as targeted promotions and seasonal product launches) that help you capitalize on trends and regional preferences.
Who’s it for | Sales directors, sales managers, business development teams, marketing managers, company executives |
How often it's needed | Daily, weekly, monthly, quarterly |
Covered KPIs | Revenue growth rate, year-over-year (YoY) sales growth, month-over-month (MoM) sales growth, sales by region, sales by product/service line, CAC, CLV, sales team performance metrics, conversion rates, average deal size, sales cycle length, customer churn rate, upsell/cross-sell success rates, market share growth, sales productivity metrics |
Sales Territory Assignments Dashboard
A sales territory assignment dashboard provides a 360° view of sales territories and rep assignments. It summarizes sales performance by territory and shows the figures behind regional revenue generation.
Observing its data allows you to find trends, high-performing areas, and underserved markets.
Applying this dashboard's insights also lets you organize territories and balance workloads more efficiently. It enables you to redistribute sales resources based on performance data and market potential to maximize revenue.
Who’s it for | Sales directors, regional sales managers, sales operations managers, business development managers, sales strategists |
How often it's needed | Monthly, quarterly, yearly |
Covered KPIs | Revenue per territory, market share by territory, account penetration rate, new customer acquisition by territory, customer retention rate per territory, territory coverage ratio, sales rep productivity by territory, opportunity win rate by territory, average deal size per territory, sales cycle length by territory, territory growth rate, cross-selling/upselling success by territory, territory potential vs. actual performance, travel time and costs per territory, customer satisfaction scores by territory |
Sales Competition Dashboard
Sales competition dashboards let you track competitions within your sales teams. By offering all employees a real-time glimpse into team performance, it can encourage competitiveness, promote a culture of accountability, and increase workplace morale.
Beyond motivation and accountability, these dashboards deliver insights into win and retention metrics. This lets you pinpoint bottlenecks in the sales process, like lengthy response times.
Moreover, sales competition dashboards provide the necessary information to address such issues with solutions such as automated follow-up systems and set response time targets.
Who�’s it for | Sales managers, team leaders, sales representatives, sales trainers, performance analysts |
How often it's needed | Daily, weekly, monthly, quarterly, yearly |
Covered KPIs | Total sales revenue, closing ratio, conversion rate, average deal size, sales cycle length, customer acquisition, upselling/cross-selling success, customer retention rate, call/meeting activity, pipeline value, quota attainment, win rate, lead response time, sales velocity, customer satisfaction score |
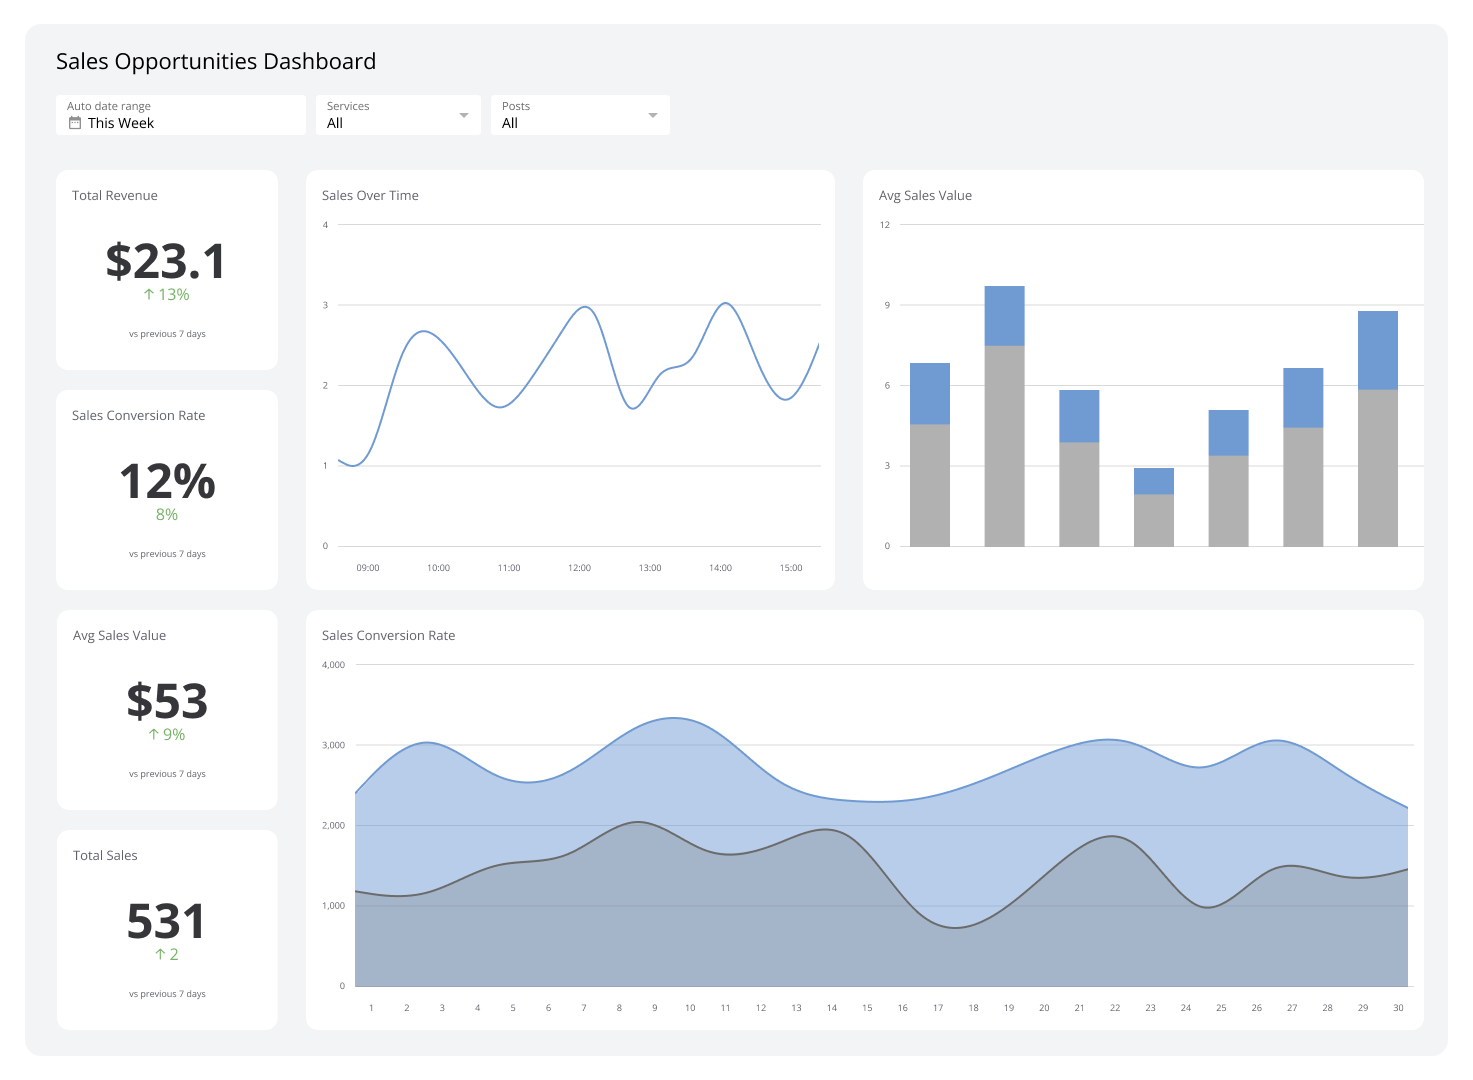
Sales Opportunities Dashboard
Sales opportunities can be challenging to identify, but sales opportunity dashboards make things easier by offering a complete view of each potential deal. This view includes metrics such as deal value, probability of closing, expected close date, and the sales cycle's current stage.
With this information readily available, your sales representatives can know where to better focus their time and resources. For example, they may prioritize high-value deals nearing their close date or sales opportunities with a higher probability of success.
Who’s it for | Sales managers, sales representatives, business development managers, account executives, sales operations teams |
How often it's needed | Daily, weekly, monthly, quarterly, yearly |
Covered KPIs | Pipeline value, number of open opportunities, average deal size, win rate, sales cycle length, conversion rate by stage, opportunity age, new opportunities created, opportunity by source, opportunity by product/service, opportunity by sales rep, probability-weighted pipeline value, days since last activity, expected revenue by month/quarter, top opportunities by value |
Sales Product Performance Dashboard
Sales product performance dashboards track everything from product sales volume and revenue to profit margins and market share, aggregating significant sales data regarding individual products. It can help you understand your product’s performance in the marketplace.
The data a sales product performance dashboard provides lets you identify top-performing products and adjust your sales efforts accordingly. Often, this involves data-driven improvements in areas like resource allocation, promo activities, and product line optimizations.
Who’s it for | Product managers, sales managers, marketing managers, business analysts, C-level executives, sales representatives |
How often it's needed | Daily, weekly, monthly, quarterly, yearly |
Covered KPIs | Revenue by product, sell-through rate, profit margin by product, market share by product, product sales growth rate, average selling price, rate of return, cross-sell/upsell rates, sales by region/territory, sales by customer segment, product penetration rate, product lifecycle stage, inventory turnover, product revenue forecast, product contribution to total sales, sales velocity by product, product discount frequency and amount, seasonality trends by product |
Customer Retention Dashboard
A customer retention dashboard is a type of sales dashboard that focuses on exploring and improving the long-term relationship between your business and its customers. It provides insights into customer behavior, satisfaction, and loyalty.
By frequently checking this dashboard, you can identify trends like an increase in churn rate or a drop in NPS. For example, if you notice a spike in customer feedback and complaints, it may be time to reevaluate your customer service processes.
Similarly, if metrics such as usage frequency drop, this could indicate a need for new product features or updates.
Who’s it for | Customer service managers, marketing teams, account managers, product managers, company executives |
How often it's needed | Weekly, monthly, quarterly |
Covered KPIs | Churn rate, CLV, repeat purchase rate, net promoter score (NPS), customer satisfaction scores, renewal rates, customer retention cost, upsell/cross-sell rates, customer feedback and complaints, retention rate by customer segment, average customer tenure, time to value, loyalty program participation and impact |
Sales Rep Dashboard
A sales rep dashboard shows how each sales rep is doing. It displays performance metrics with charts, tables, and graphs so you can determine strengths and weaknesses. Some of these metrics include activities completed, upsell rate, and time spent on selling activities.
Keeping an eye on the live metrics of a sales rep dashboard gives you the means to refine and optimize conversion strategies. By analyzing individual performance patterns, you can identify best practices from top performers and implement targeted coaching for underperforming reps.
In addition, this dashboard may help your managers make changes to enhance your sales process. By showing the numbers behind customer interactions, they can identify and employ high-impact strategies, such as prioritizing early product demonstrations to increase conversion rates by up to 30%.
Who’s it for | Sales representatives, account executives, business development representatives, inside sales reps, field sales reps |
How often it's needed | Daily, weekly, monthly, quarterly, yearly |
Covered KPIs | Individual sales quota attainment, number of deals closed, revenue generated, average deal size, win rate, sales cycle length, pipeline value, activities completed, lead response time, conversion rate by stage, opportunity age, cross-sell/upsell rate, customer retention rate, average discount given, days since last customer contact, number of qualified leads generated, sales forecast accuracy, time spent on selling activities |
Sales Status Dashboard
Sales status dashboards display the advancement of sales targets, regional sales, and overall revenue growth. They present a comprehensive picture of sales status, giving you the insight needed to make changes that can drive your sales forward.
For instance, a sales status dashboard might reveal that while total revenue has increased by 15%, the average deal size has decreased by 10%. Pricing strategies or changes in customer buying patterns are often the reasons behind such figures.
Knowing this, you can make timely changes to keep your average deal size in line with total revenue.
Who’s it for | Sales managers, sales directors, VPs of sales, chief revenue officers, CEOs, business analysts |
How often it's needed | Daily, weekly, monthly, quarterly, yearly |
Covered KPIs | Total revenue, revenue by product/service, revenue by region, sales growth rate, total pipeline value, forecasted revenue, average deal size, win rate, average sales cycle length, total number of opportunities, conversion rates by stage, team quota attainment, top-performing products/services, customer acquisition cost, customer lifetime value, market penetration rate, sales velocity, lead-to-opportunity conversion rate |
Monthly Sales Dashboard
A monthly sales dashboard streamlines monitoring monthly progress across your entire team. It cultivates transparency and departmental alignment by showcasing current performance and business targets.
Moreover, this dashboard boosts workplace efficiency by eliminating the need to rely on weekly Excel or Google reports that take much effort to create and update.
Who’s it for | Sales teams, marketing teams, management, finance teams |
How often it's needed | Monthly |
Covered KPIs | Total sales, sales target achievement, new leads generated, CAC, revenue per customer, sales growth, sales by product or service, sales cycle length, customer retention rates, sales rep performance |
Sales Cycle Length Dashboard
Get a thorough breakdown of your sales cycle using a sales cycle length dashboard. With it, you can view metrics that provide deep insights into the duration and effectiveness of each stage of your sales process.
A sales pipeline dashboard also informs you about the current opportunities at each stage of the pipeline.
More importantly, it tracks conversion rates at each stage, identifying where drop-offs occur, allowing you to make improvements such as implementing targeted follow-ups for stalled deals, offering promotions to grow leads, and enhancing sales rep training with personalization.
Who’s it for | Sales teams, sales managers, executives |
How often it's needed | Weekly, monthly, quarterly |
Covered KPIs | Sales cycle duration, deal size, number of deals closed, stage duration, pipeline velocity, win rate, conversion rate, lead response time, lost deal analysis, sales rep performance |
Sales Engagement Dashboard
Sales engagement dashboards are instrumental in informing you about outbound performance indicators, outreach campaigns, and conversion success between channels. They typically display metrics such as email open rates, response rates, and lead conversion rates.
By looking at this type of sales dashboard, you can identify effective outreach strategies like targeted messaging and personalized follow-ups and then improve them.
Moreover, you can also view conversion success across channels, allowing you to make changes like improving closing rates to shorten the sales cycle.
Who’s it for | Sales managers, sales teams, company executives, sales directors |
How often it's needed | Daily, weekly, monthly, quarterly |
Covered KPIs | Engagement rate, click-to-open rate (CTOR), response rate, call arrival rate, call completion rate, meeting scheduled rate, follow-up activity, sales cycle duration, content engagement, lead conversion rate, touchpoint frequency, time from inquiry to response, prospecting activity, deal win rate, pipeline volume, lead response time, customer satisfaction score |
Win-Loss Dashboard
With a win-loss dashboard, you can visualize all data related to win rates. Viewing it is necessary to see the rise and fall of these rates and pinpoint performance trends. This sales dashboard is built on metrics like stage analysis, customer feedback, and average deal size.
By making these metrics accessible, you get information that fuels decision-making regarding how to boost sales.
For example, you can determine at which stage deals are most frequently lost and implement process tweaks to address these weak points, leading to higher win rates.
Who’s it for | Sales managers, sales teams, account managers, individual sales representatives, company executives |
How often it's needed | Weekly, monthly, quarterly |
Covered KPIs | Win rate percentage, loss rate and reasons, average deal size, sales cycle length, deal stage analysis, competitive analysis, customer feedback, sales rep performance, market segment analysis, product/service analysis, lead source analysis |
Deal Performance Dashboard
Deal performance dashboards give you the opportunity to examine your sales deals, letting you determine whether they’re likely to close or fail.
On top of that, it allows you to view pipeline changes within specific time periods.
In particular, you can quickly identify and address potential risks by closely monitoring the health of deals in the pipeline. For instance, if a deal has been stagnant at a particular stage for a long time, it may signal immediate issues, such as poor buyer engagement or competitive pressures.
Who’s it for | Sales managers, account managers, company executives, sales teams |
How often it's needed | Weekly, monthly, quarterly |
Covered KPIs | Deal velocity, conversion rates, lead-to-opportunity ratio, pipeline value, stage duration analysis, competitive positioning, customer engagement metrics, sales rep effectiveness, revenue forecast accuracy, product/service performance, channel effectiveness analysis |
Sales vs. Margin Dashboard
Top-line revenue is only secondary to profitability, and a sales vs. margin dashboard provides insights into both sales performance and profit margins. By showing metrics like gross margin, net profit margin, and cost of goods sold (COGS), you can understand the profitability of your sales efforts in greater detail.
Who’s it for | Finance teams, sales managers, company executives, business analysts, financial controllers |
How often it's needed | Weekly, monthly, quarterly |
Covered KPIs | Total revenue, gross margin, net profit margin, cost of goods sold (COGS), average selling price, sales volume, discount rates, profit per product/service, customer acquisition cost, return on sales (ROS), product line profitability, regional profit contribution |
Consumer Sales Dashboard
A consumer sales dashboard provides data on margins, sales, and budgets in one intuitive interface. It provides invaluable insights across many dimensions, such as by sales rep, product, city, state, or region, allowing you to better track your consumer sales.
For example, geographical sales data, such as city, state, or region sales, give you a firmer grasp of market dynamics and allow you to assign resources effectively.
Meanwhile, following this dashboard's sales and budget metrics can grant insights into gross profit, operating profit, and net profit, enabling you to learn the financial health of your sales activities.
Who’s it for | Sales managers, regional managers, company executives, marketing teams, business analysts |
How often it's needed | Daily, weekly, monthly |
Covered KPIs | Total sales, sales by product, sales by rep, sales by city/state/region, profit margins, budget vs. actual sales, customer acquisition cost, conversion rates, average transaction value, customer lifetime value, sales growth rate, inventory turnover, sales targets vs. actual |
Competitor Analysis Dashboard
A competitor analysis dashboard provides data on your competitors' performance, market positioning, and strategies. It offers deep insights across many dimensions, such as product offerings, pricing, market share, and marketing tactics, allowing you to better understand your competitive landscape.
Tracking competitors' product launches and pricing changes on this dashboard helps you predict market trends and adjust your offerings accordingly. In addition, following its market share and growth metrics can give you insights into competitors' strengths and weaknesses, enabling you to find opportunities for your sales team to capitalize on and threats to mitigate.
Who’s it for | Sales managers, product managers, marketing teams, business development executives, strategic planners, company leadership |
How often it's needed | Daily, weekly, monthly |
Covered KPIs | Competitor market share, competitor product offerings and features, competitor pricing strategies, competitor sales growth rates, share of voice (social media and online presence), customer satisfaction scores (if available), competitor marketing campaigns and channels, SWOT analysis, competitor partnerships and alliances, patent and innovation tracking, competitor financial performance, geographic presence and expansion, customer demographics and target markets, sales team size and structure, distribution channels used |
Simplify sales data acquisition
A sales dashboard delivers sales metrics through visualizations like interactive charts and graphs. It simplifies the sales data acquisition process and provides the insights needed to boost revenue, improve customer retention, capitalize on opportunities, and see changes or trends in the marketplace.
Klipolifo’s customizable sales dashboards deliver accurate, real-time data. Try it for free today and better understand your sales efforts.

