Semantic layer vs metric layer, or a hybrid solution. Which is right for me?

Summary: Metrics can be created, managed, and consumed by data stacks containing a semantic layer, a metrics layer, or a hybrid solution. The choice of which system to use comes down to various factors, such as the current data infrastructure in the organization, the scale of the data being processed, the needs and experience of the data teams and data consumers, and the overall investment in data solutions.
Metrics provide a powerful way for analysts and decision-makers to work with data that’s been curated and optimized for consumption. There are various technical solutions for metrics, making it challenging at times to understand which one is best for your organization and its data. This article helps you decide which path to choose by comparing and contrasting the primary technology types: Semantic layer, metric layer, and a hybrid approach that uses both.
The semantic layer solution
Semantic layers are making waves in the industry as the next evolution of data transformation toolkits for data teams. This technology creates a framework within which data teams define and manage metrics. The metrics are then made available to the decision-makers, delineating the roles of the data team and business team when it comes to an organization’s data. Some examples of such tools are dbt Semantic Layer from dbt Labs and Looker Modeller from Google.
A semantic layer does not store data. Rather, it allows for meaning (metric definitions) and structure (semantics) to be assigned to data through added metadata. Metric definitions represent a consistent abstraction of the data in a way that’s easily understood and consumed. Part of this abstraction is a consistent and simplified way to query metrics that optimizes the consumption of the metric data for analysis.
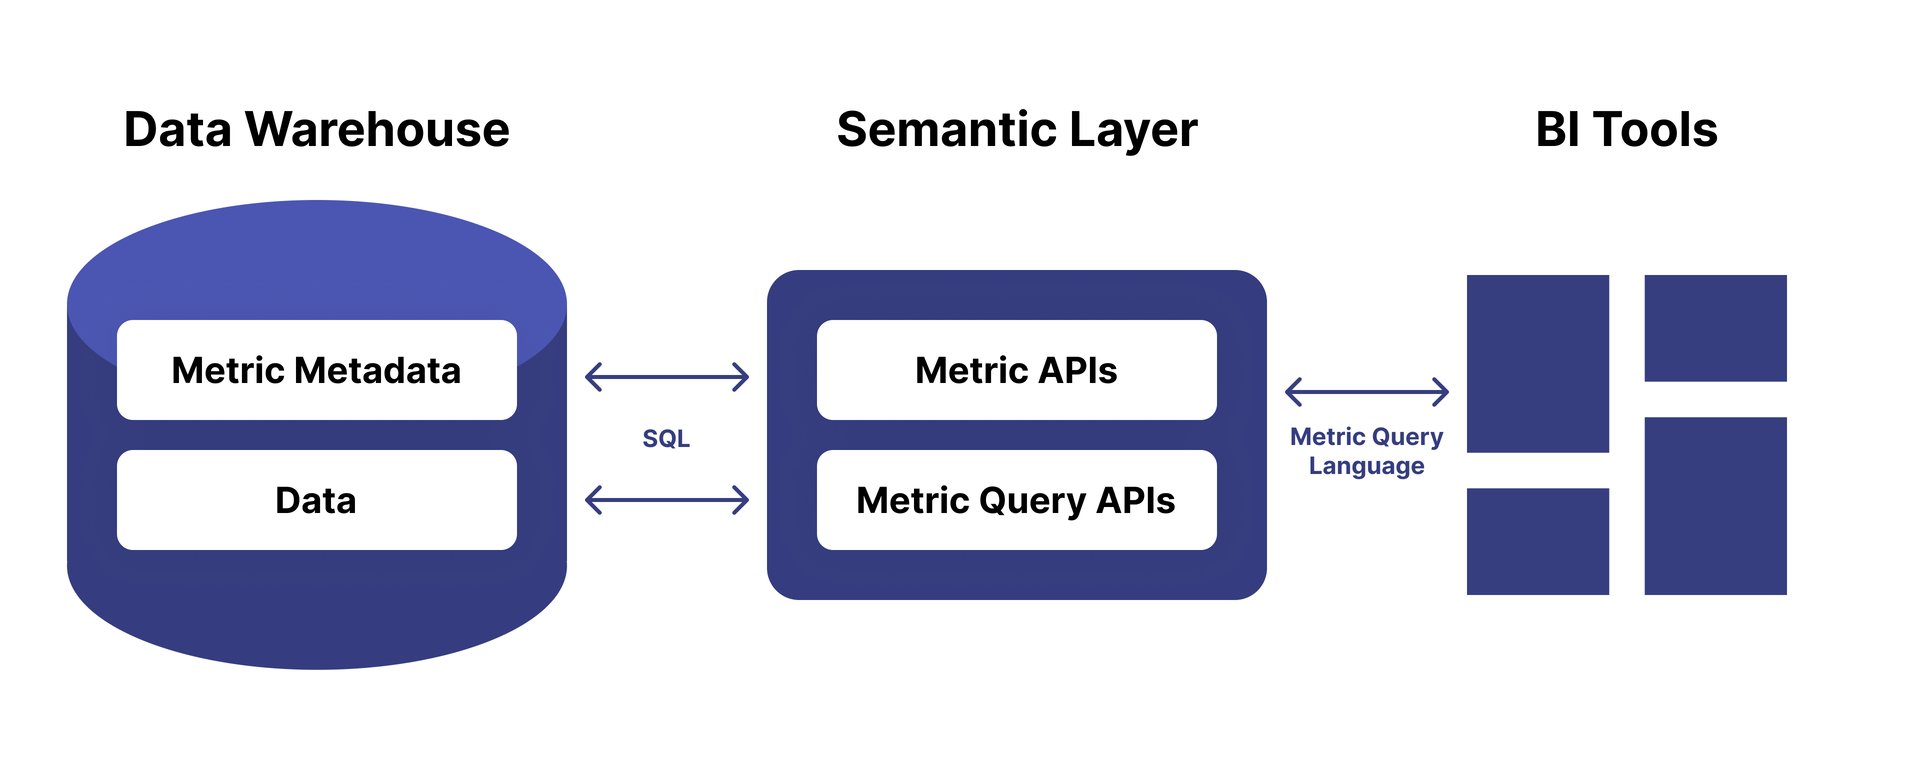
Semantic layers allow for metrics to be defined on top of the existing data in the data warehouse. Metric queries are translated into raw SQL to get and process the data that are returned to a data analysis tool.
When querying a metric in a semantic layer, the query is transformed into raw SQL according to the rules as described by the data team in the metric definition. This allows the data in the database to be accessed as a metric, even though it’s not structured that way in the underlying storage.
One of the attractive features of a semantic layer is that it doesn’t require the raw data to be restructured significantly or moved into other data storage systems. This allows data teams to continue managing their data in the way they’re used to. For example, previous investments in dbt to model, transform, or clean raw data stored in a data warehouse can be leveraged directly by the dbt Semantic Layer.
The metric layers solution
Metric layers expose metric artifacts that can be used in much the same way as those from semantic layers. However, unlike the metrics from a semantics layer (including rules on how to query raw data but not store data), the artifacts from a metrics layer include data and meaning. Data is stored directly in the metric layer for each metric that’s defined in the system. When creating a metric, you define a set of data transformation rules for the source data so it can be ingested into the metric in the appropriate structure. These transformation rules are applied to the source data at regular intervals to capture new data for the metric. All metrics in the system store their data in much the same way regardless of the data's original structure or where it came from.

Metric layers store all the information relevant to a metric, including its definition and its data. Transformation and ingestion rules are defined so the system can convert raw data into a format that’s more efficient for the query and storage of metric data.
Lightweight business intelligence tools that have built-in metric layers enable an optimized experience for the management and consumption of metrics. PowerMetrics is an example of an analytics solution with a built-in metrics layer.
There are several benefits to built-in metric layers, including the speed at which metrics can be set up and made available. In addition, metric layers store the history for a metric even if it's not available in the source data, allowing for deeper time-series analysis across all metrics in the system. Built-in metric layer technology also includes lightweight analysis and visualization capabilities that are optimized to work with metric data. In addition, the metric layer provides the framework that’s needed to define and store metric data in one place. This simplified data stack is less expensive to maintain and manage.
The hybrid solution
Hybrid solutions are possible because of the similarities in how metrics are consumed in semantic layer and metric layer technologies. You can combine metrics from either type of system to make new metrics. This is often done by referencing multiple metrics using a formula. For example, you can make a “Profit” metric using the formula “Revenue metric minus Expenses metric”. The term composable is commonly used to define this property of metrics. In PowerMetrics, we call them calculated metrics.
Alternatively, metrics from both types of layers can be combined in the same visualization or report by combining the data using a common data context similar to a data join.
Hybrid tools often include metric management features, such as permissions and metric certification. They provide a common catalog of metrics in one place for more effective access to and distribution of metrics across all teams.
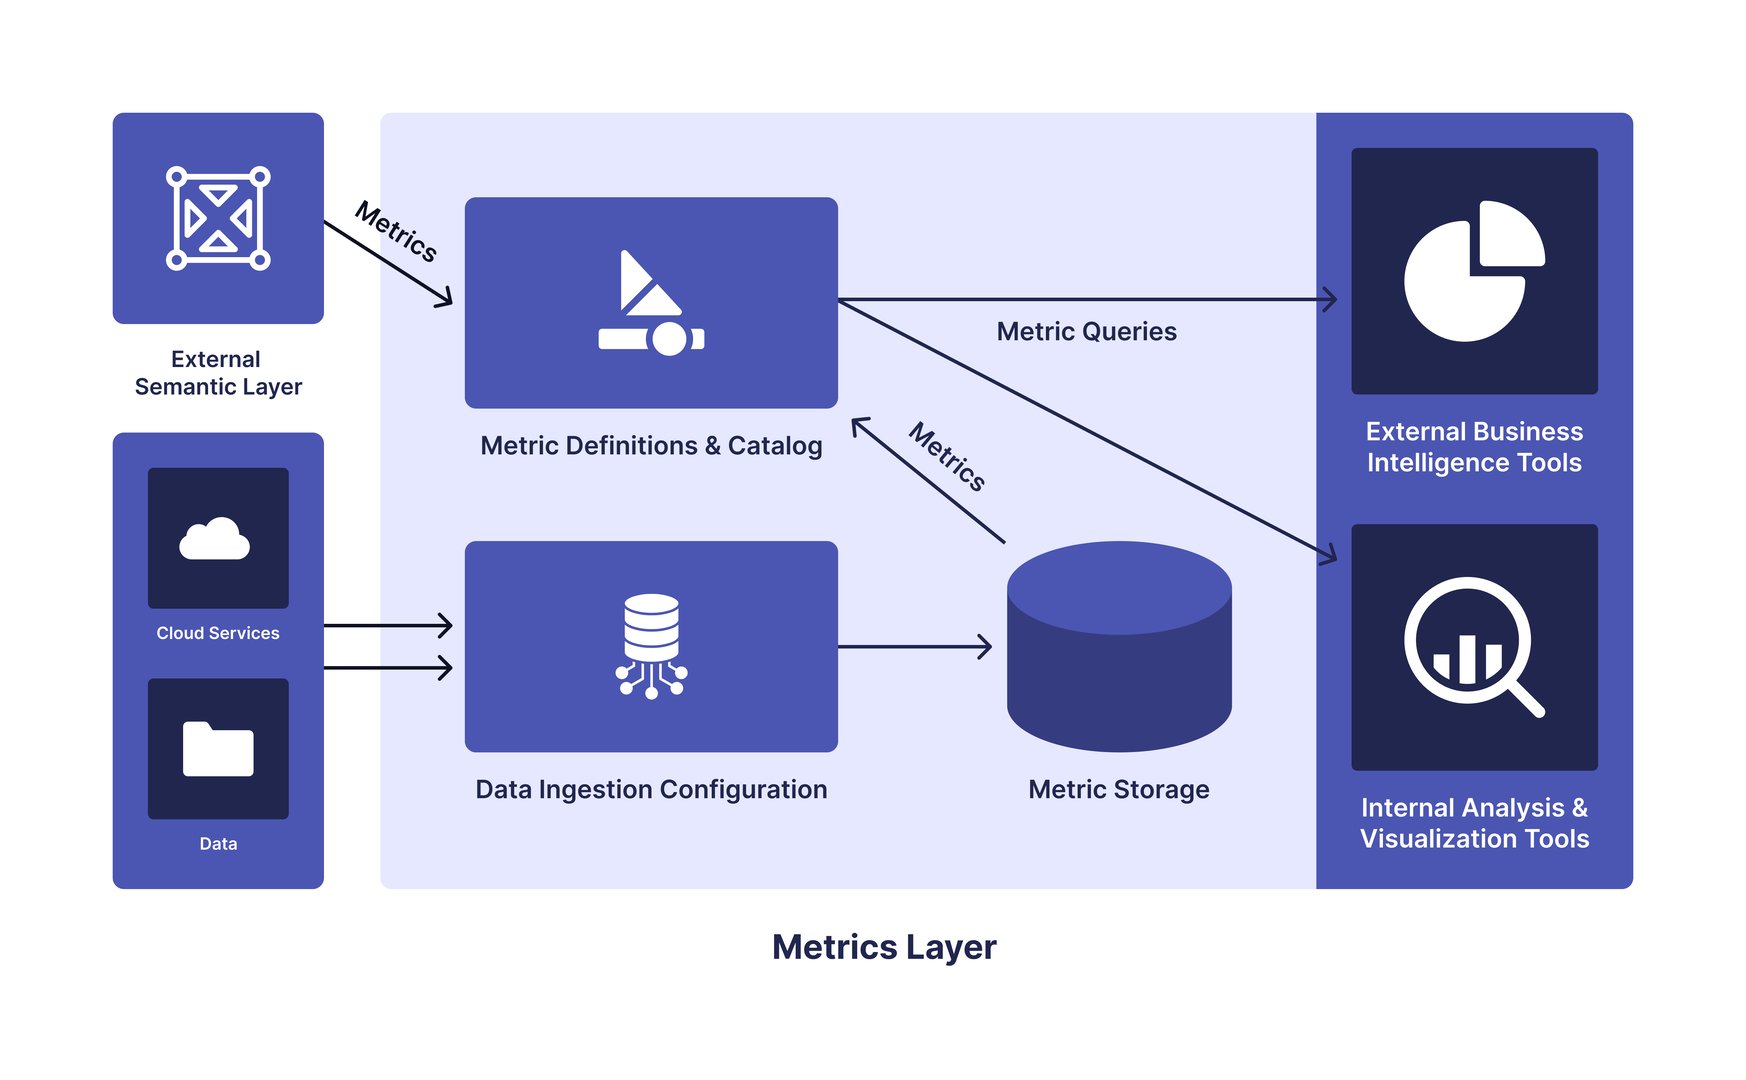
Hybrid approaches provide a wide range of possible data sources and the optimized storage of a metrics layer. They also provide access to metrics that are defined and managed by data teams in a semantic layer.
Besides being a metric layer solution, PowerMetrics is an example of a hybrid solution as well; you can use it to create metrics from various data sources and APIs and process and materialize external metrics from dbt. Both types of metrics are accessible from a single, central location and can be used across the organization for dashboards, visualizations, and analyses.
Which solution is right for me?
Since semantic layers and metric layers enable metric artifacts with similar capabilities, the decision on which to use depends on how your organization manages its data and metrics. Answering the following questions will help you decide which technology is right for your business – will you use a semantics layer, a metrics layer, or a combination of both?
Where is my data stored?
Many mature, data-driven organizations have already refined their data collection and consolidated their data into data warehouses. They’ve also invested time and money into setting up proper data governance and compliance around a single or minimal set of data storage systems. Typically, these systems use traditional databases where data is accessed using SQL. A semantic layer approach is particularly appealing to this setup because it fits over the existing data storage and doesn’t require a significant investment in moving data or applying new governance rules.
Up-and-coming organizations often don’t have an existing data storage and governance system. Instead, they rely on out-of-the-box data services to store most of their data or use spreadsheets and other file-based data storage systems. The built-in data storage and the flexibility of data consumption from a broader set of APIs and data sources can make a metrics layer approach more desirable to these organizations.
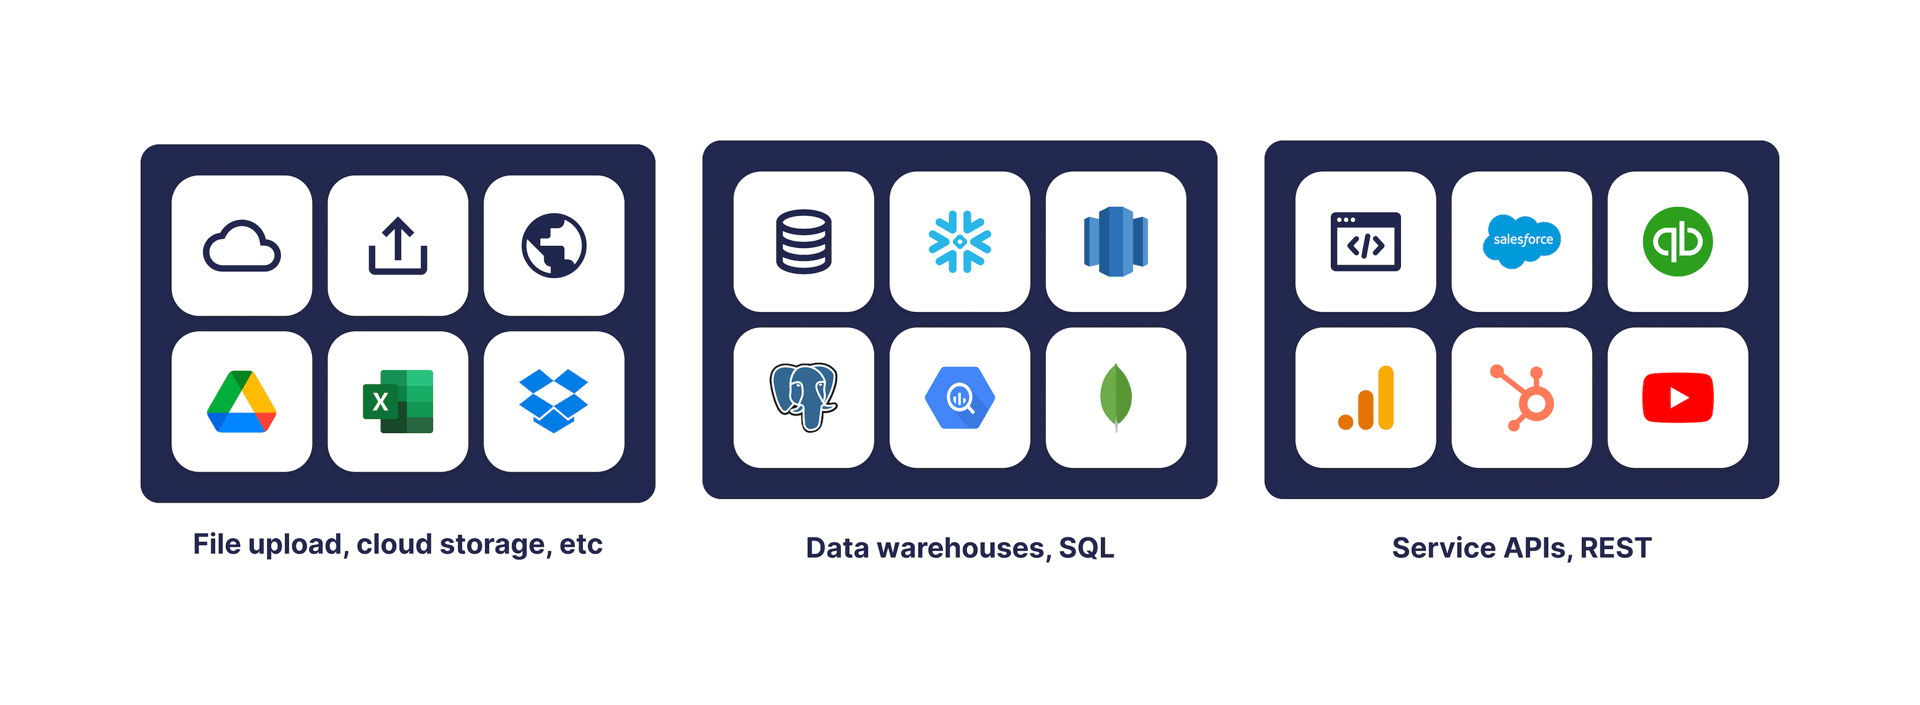
Being able to connect to a large set of services and APIs is a benefit of using a tool with metrics layers, like PowerMetrics.
Many large organizations have centralized data storage and governance for core business data but also have specific departmental data that are not stored in the primary systems. In such organizations, a hybrid approach is often best as it allows both types of data to be used effectively for analysis by consumers in the form of metrics.
How much data do I have, and how is it distributed?
There’s no better technology than a data warehouse for storing lots and lots of data. Data warehouses are designed to systematically store data in quantity and, when data is properly structured and queried, to enable efficient access to all of that data. If your organization has a lot of data you need to surface in your metrics, there’s no better way to go than with a data warehouse and a semantic layer.
Some organizations don’t have large quantities of data that they manage themselves. If the data is already refined and accessible through APIs, then a metrics layer approach is probably easier to set up and manage.
In organizations with both large, centralized data storage systems and departmental data and data tools, a hybrid approach offers the flexibility needed to consume and make use of all the data that’s available.
Does my organization have an experienced data team?
For metrics to be useful, they must be correctly defined and efficient to query. The level of expertise required to define and manage metrics and ensure they’re correct and performant depends on the metric system being used.
In a semantic layers system, the definition and efficiency of the metric are governed by the underlying storage and by the transformation rules as defined in the metric. Data is retrieved using SQL queries, a process which can vary greatly in performance. As a result, the efficiency when accessing data to build metrics can also vary greatly. In such cases, a data team with the technical expertise to optimize metric definitions for the best possible performance is needed.
Metric layers already have optimized data storage and query layers. This is because they’re not built for generalized data storage and access – they’re built for metrics. A lot of care has already gone into optimizing these systems for metrics, so less technical expertise is needed to define effective and efficient metrics. In organizations that don’t have an experienced, dedicated data team, a metrics layer approach is usually a good fit.
Many large companies need to combine their centralized data systems and their departmental data. While still requiring data experience, a hybrid solution (that consolidates all of the organization’s data into a single location) makes it possible for users to consume all of that data via metrics.
How will metrics be provided to business teams?
The capabilities of the metric artifact are virtually identical whether the metrics come from a semantic layer, a metric layer, or a hybrid of both. However, the organization also needs to think about how they’ll manage the metrics and provide access to them for their business teams.
Semantic layer systems require dedicated data teams to build and manage metrics. This is a positive feature when it comes to data governance and access control. However, it adds complexity when providing new metrics for consumers since only the data teams can build them.
With metric layers, data consumers can self-serve and get access to new metrics either by combining existing metrics into new metrics, importing metric definitions from well-known data services, or creating metrics using their own data. This design helps data consumers by giving them fast access to the metrics when they need them. However, it can also lead to too many defined metrics being added to the system (aka metric bloat) and create a situation where it’s not clear which metrics should be used.
Hybrid approaches balance efficiency for consumers by providing a single place to see and manage all their metrics, regardless of whether they come from semantic layers or metric layers. This single point of access, often referred to as a metric catalog, lets data teams control which metrics are exposed and identify verified metrics for official use by the business teams. With access to the metric catalog, data consumers can independently get the metrics they need to make informed business decisions without requesting help from the data team.
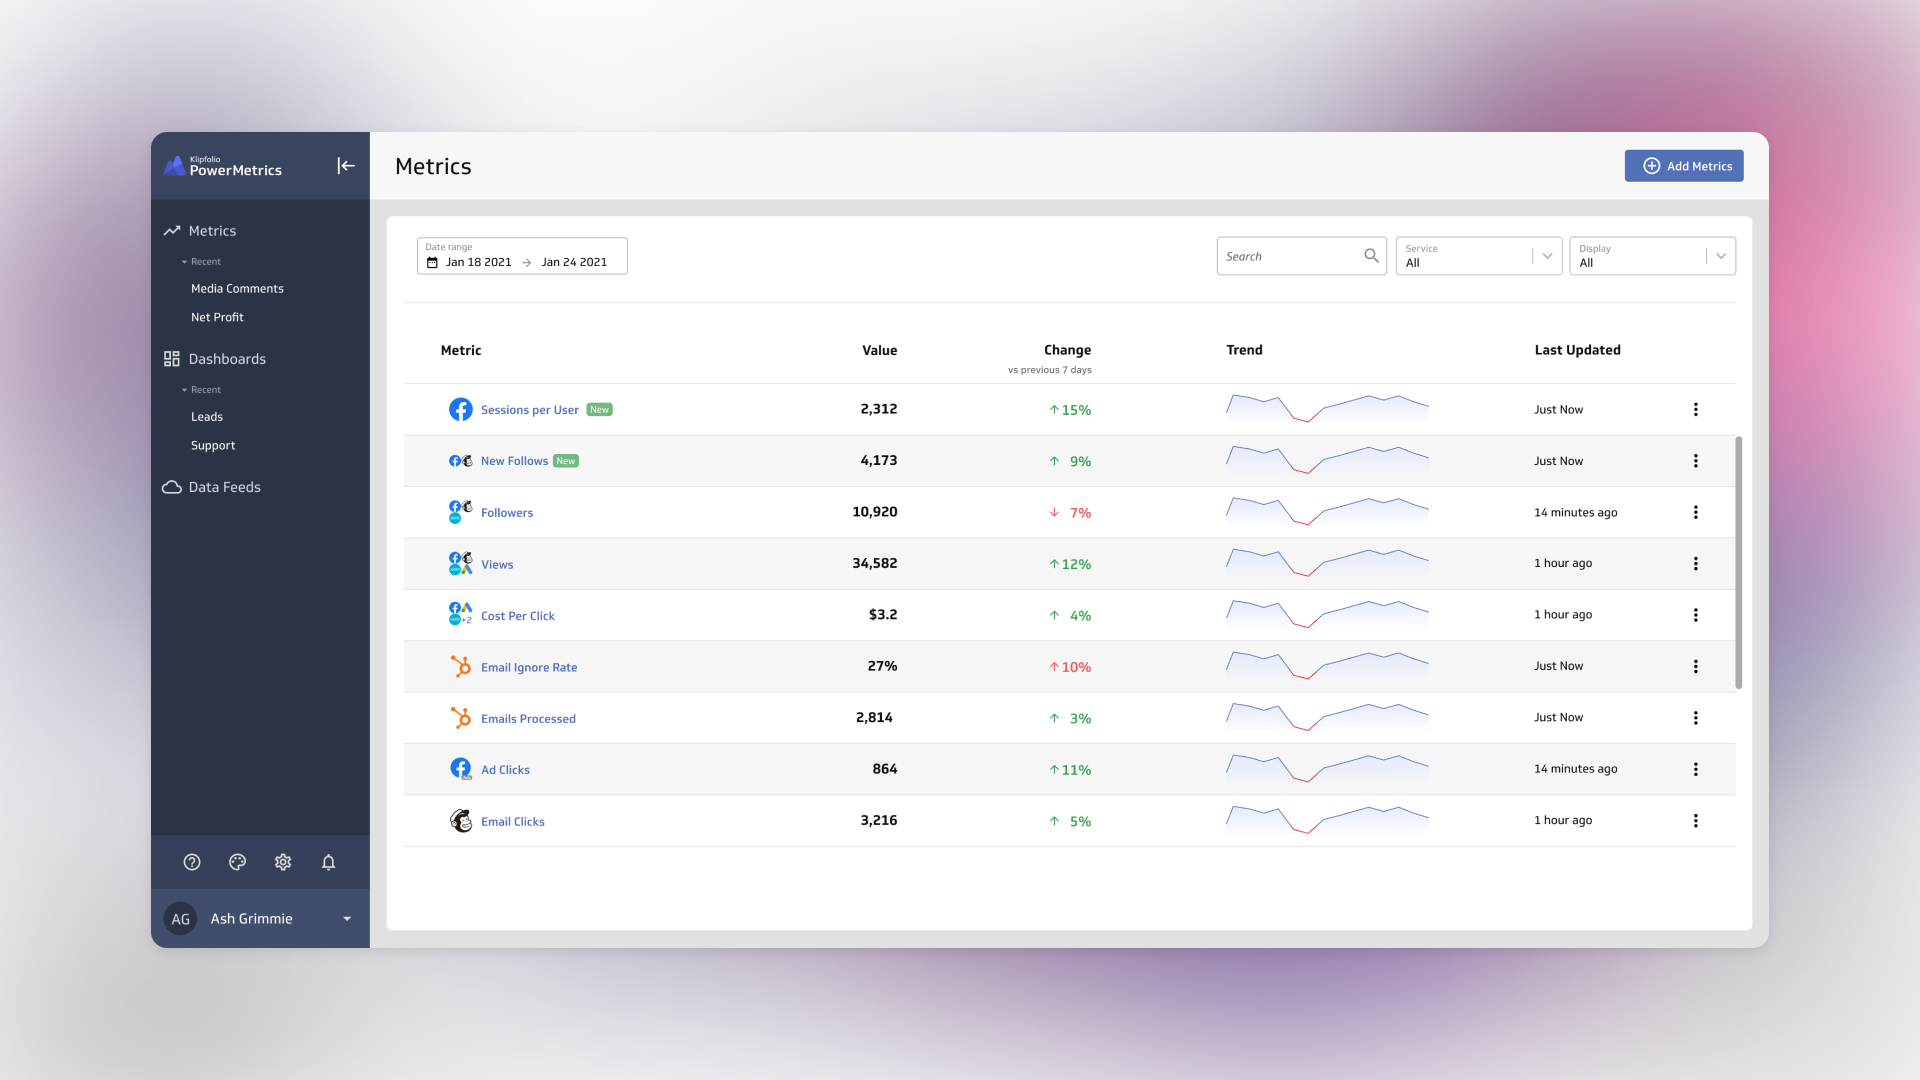
A metrics catalog gives data users access to metrics that are built by the data team. Straightforward built-in analytics and dashboarding features enable users to directly work and share data.
How much do I want to invest?
Semantic layers are, by definition, a part of a larger modern data stack. As such, this solution usually only provides the metric definition components and APIs to access the metric data. An investment is required in downstream analytics or lightweight business intelligence tools, such as Mode or Lightdash, to enable the business user or analyst to consume, visualize, and process the metrics that are defined in the semantic layer.
Products containing a metrics layer provide complete solutions that include metric definition and management components as well as visualization and analysis tools. These in-a-box solutions are usually less expensive and often available as SaaS offerings, reducing the upfront financial commitment.
Because hybrid solutions are built on metrics layers, they include lightweight built-in analysis and visualization tools. As a result, no extra investment is required to consume semantic layer metrics. However, APIs can be provided to gain access to the metric catalog or the metric data that comes from the built-in analysis tools.
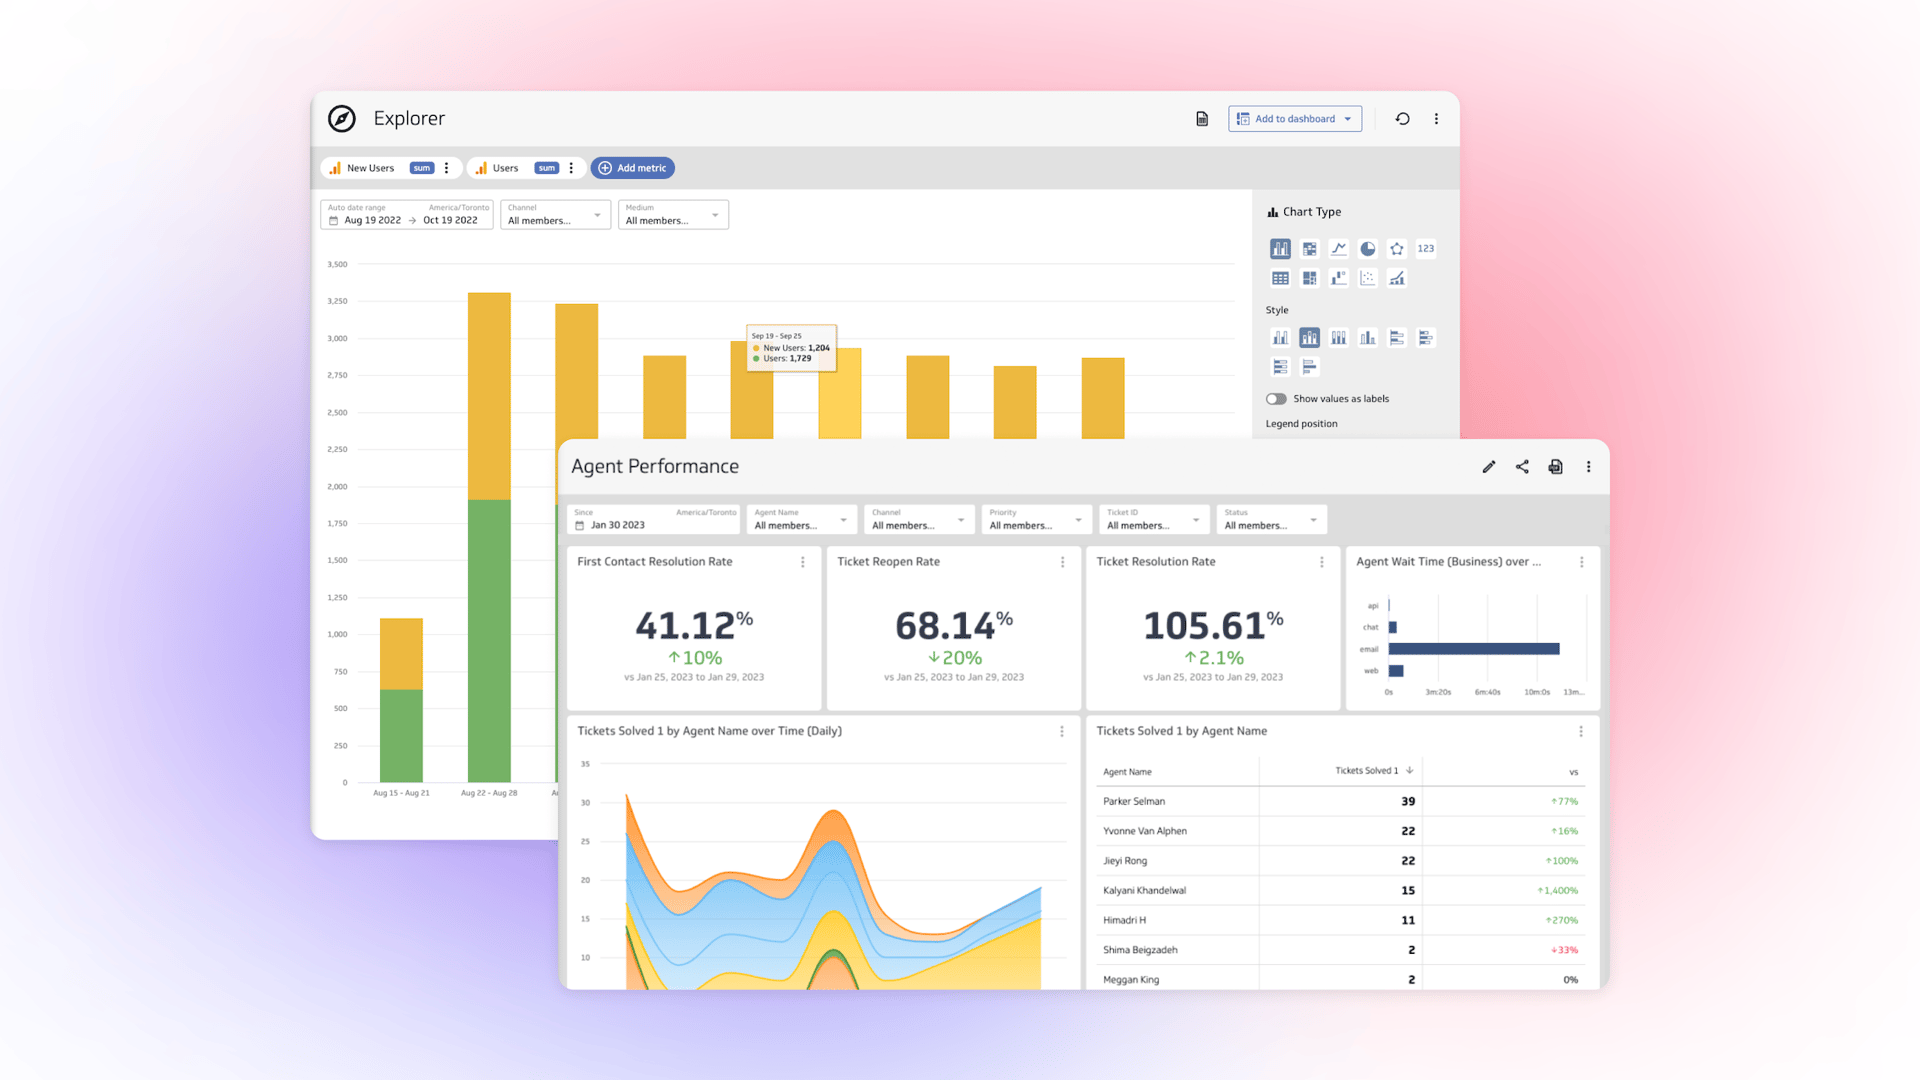
PowerMetrics provides a visualization and analytics layer that’s purpose-built for the consumption of metrics.
Your data. Your choice.
Metrics empower data consumers by offering insight and fuelling better decisions. Any of the platforms described in this article can be used to manage, process, and analyze your data, however, the solution you choose has to work for your business’s specific infrastructure and unique needs.
Like any technology investment, decisions should support your organization's future direction and growth. Of the solutions above, the hybrid approach is the most future-proof. A hybrid solution allows a broader set of data sources while also enabling a true semantic layer for data volume and data governance – essential features as your organization grows and matures. The flexible nature of a hybrid solution means your organization can start with either a semantic layer approach or a metrics layer approach and expand from there.