Case Study: How Media Propulsion Laboratory improved client analytics with the PowerMetrics – BigQuery integration

Summary - This case study explores how digital media agency Media Propulsion Laboratory (MPL) improved their end clients’ data reporting and visualization with PowerMetrics. Using the PowerMetrics integration with Google BigQuery, MPL gained dynamic self-serve analytics for their clients and the ability to manage large datasets efficiently.
Introduction
In this case study, we learn how Media Propulsion Laboratory (MPL) uses PowerMetrics to enhance their digital media strategies and provide their clients with advanced, user-friendly analytics. With a diverse group of customers and ever-growing volumes of data, MPL was looking for a self-serve analytics solution with scalability. Shifting from Google Sheets and Looker Studio to BigQuery and PowerMetrics allowed MPL to manage larger datasets more efficiently and cleared the way for real-time data access. Clients can now manipulate and visualize data independently, improving not only their autonomy but also the quality of their reports. This study highlights the benefits of adopting an integrated data solution for robust, responsive digital marketing.
About Media Propulsion Laboratory
MPL, part of the Craft&Crew Group of companies, is a digital advertising planning and buying agency. They work with partner agencies and end clients to improve their paid digital media strategy and campaigns. Their focus? Delivering meaningful results and maximum return. MPL began working with Klipfolio in 2023.
About our clients
We work with other agency partners within the creative, branding and offline media space, as well as our own end clients. Our goal is to help all of our customers achieve their paid media objectives. This usually means driving full-funnel demand and sales for e-commerce, telecommunication, and SaaS companies, supporting clients in consumer packaged goods (CPG), government, and not-for-profit organizations, and other objectives for various industry verticals.
About Richard Marginson, General Manager
For over a decade, Richard has led digital marketing initiatives across the private, public, and not-for-profit sectors, working with clients such as VIA Rail Canada, Xplore, the Canadian Professional Sales Association, and AutoTrader. Richard develops and implements programs and campaigns from end to end. Richard specializes in drawing insights from digital, company, and industry data. Based on that data, he builds testing hypotheses to foster new product development, better conversion rates, stronger acquisition funnels, and higher retention rates.
PowerMetrics use case
We use PowerMetrics to support our end clients’ reporting and visualization needs. PowerMetrics, by providing self-serve data access to our clients, solved one of the biggest challenges we previously faced with data reporting. Our clients can now access and manipulate their own data, combining, slicing, and visualizing it to suit their reporting needs. This ease of access is especially beneficial for our agency clients, who, in the past, often had to request data from us to wrap into larger client reports.
Why we changed from Looker Studio to PowerMetrics
Before switching to PowerMetrics, we managed data using a massive spreadsheet and Looker Studio. It turns out, Google Sheets sucks at scaling! Each workbook has an overall cell limit and, given the amount of data we were ingesting daily, we hit that limit pretty quickly. We tried breaking our spreadsheets out into unique workbooks for each channel, but this caused issues with our dashboard integrations and strained the Google Sheets connections. We always knew we’d eventually need a more robust data warehouse solution, but we didn’t anticipate how soon that day would come. Our Google Sheets solution just couldn’t handle the mass amounts of micro campaign data produced by our clients. For example, our creative agency partners are, understandably, interested in creative performance. Bringing in creative-level data from these platforms exponentially increases the number of rows we need to fetch and store.
Using Looker Studio to parse and filter all of this data was a slow process - much slower than processing data within a data warehouse. We also weren’t happy with Lookers’ inability to deeply analyze metrics and customize visualizations in a dynamic and self-serve way. In the end, our reporting solution, built on duct tape and hope, needed to change.
The Klipfolio team has been with us every step of the way throughout the transition process. The Professional Services and Implementation team helped us learn the product and guided us with onboarding and training. A huge thank you once again to the entire team at Klipfolio for embracing our partnership, digging in with us and helping us deliver an amazing reporting service to our clients.
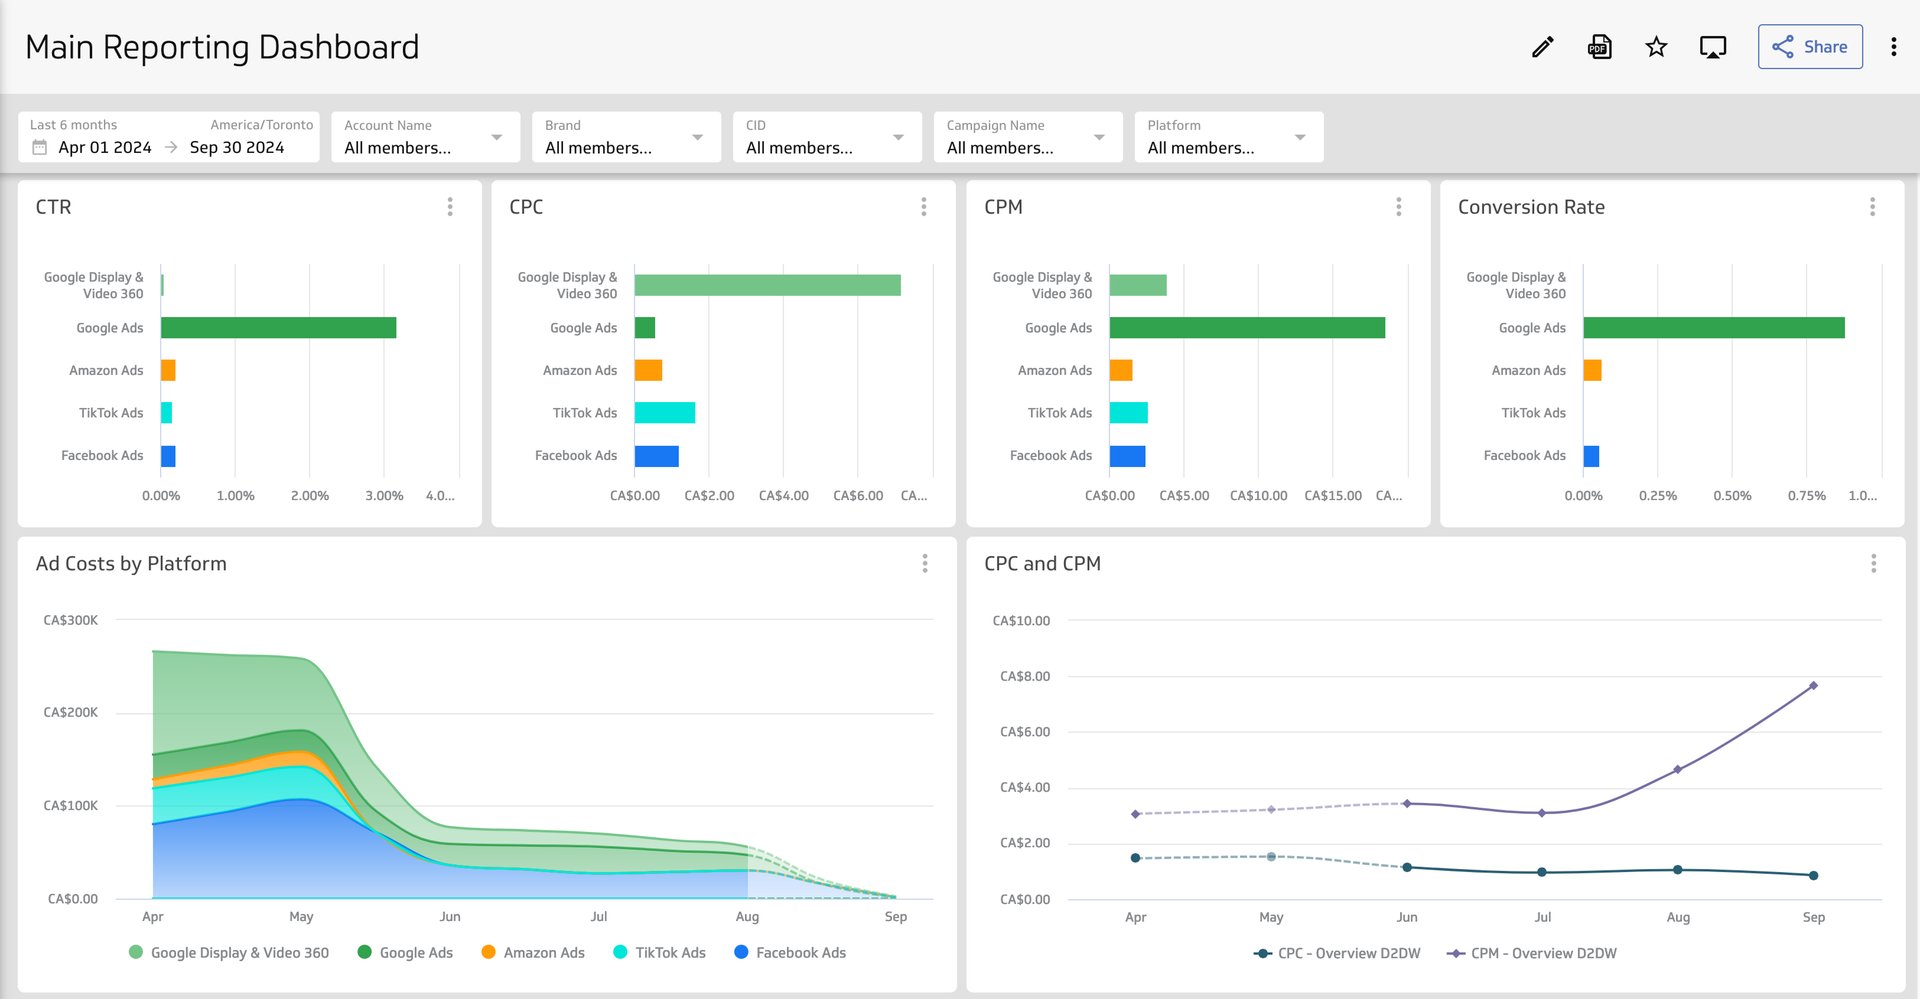
Accessible, flexible self-serve analytics
Our customers love how they can quickly and easily access, visualize, combine and manipulate metrics in PowerMetrics. They can create reports for their clients or stakeholders and get easy access to up-to-date data. They also appreciate being able to dive deep into a metric’s data, customize metric visualizations, and layer data to suit their personal reporting needs. PowerMetrics, with its flexible, usable design enables our clients to create more dynamic client and stakeholder reports than they could with Looker Studio dashboards.
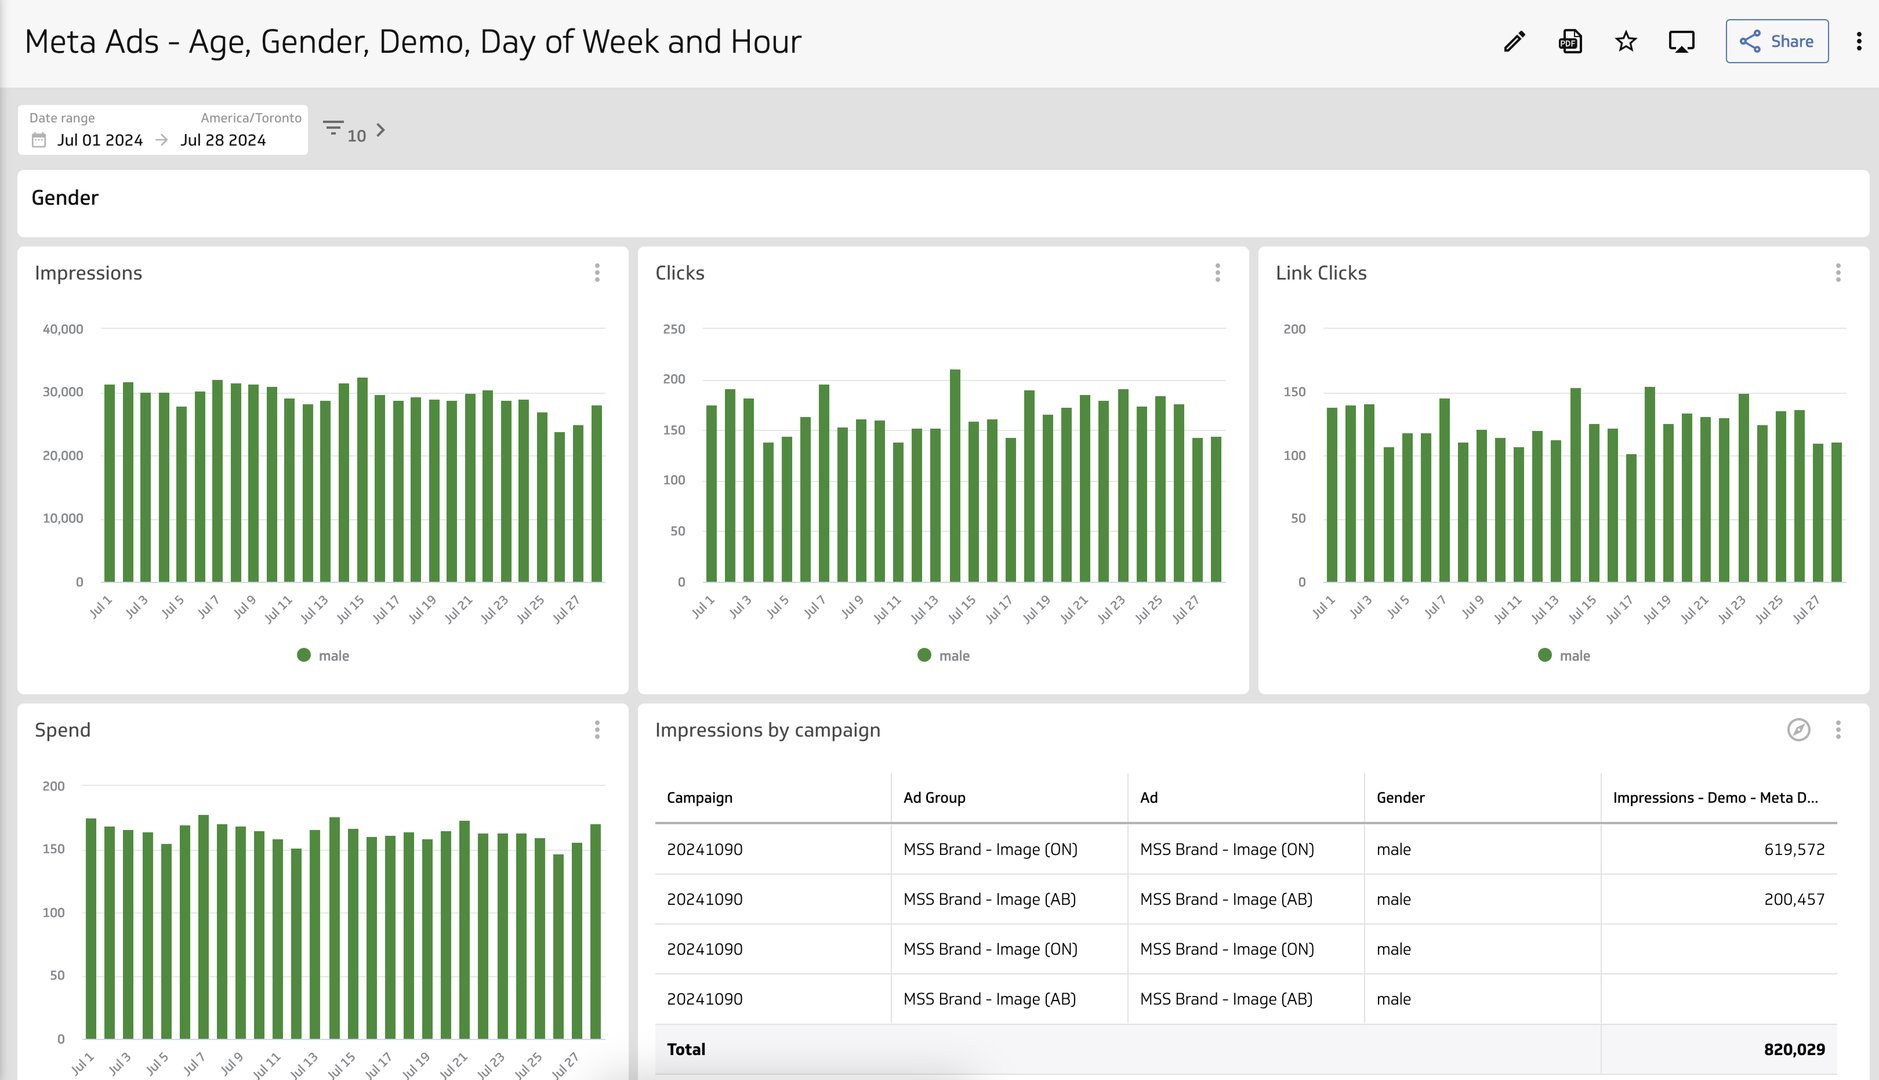
There are still some challenges for clients who want to view their performance at-a-glance, especially in a table format. Recently, Klipfolio improved tables by adding a summary row. They also adjusted the file naming convention, so when a table’s data is downloaded, it can open properly in Excel. In future, we’re hoping to see the ability to combine more metrics and dimensions into a single table for an at-a-glance view of performance.
Integration with BigQuery allows for efficiency, scale and performance
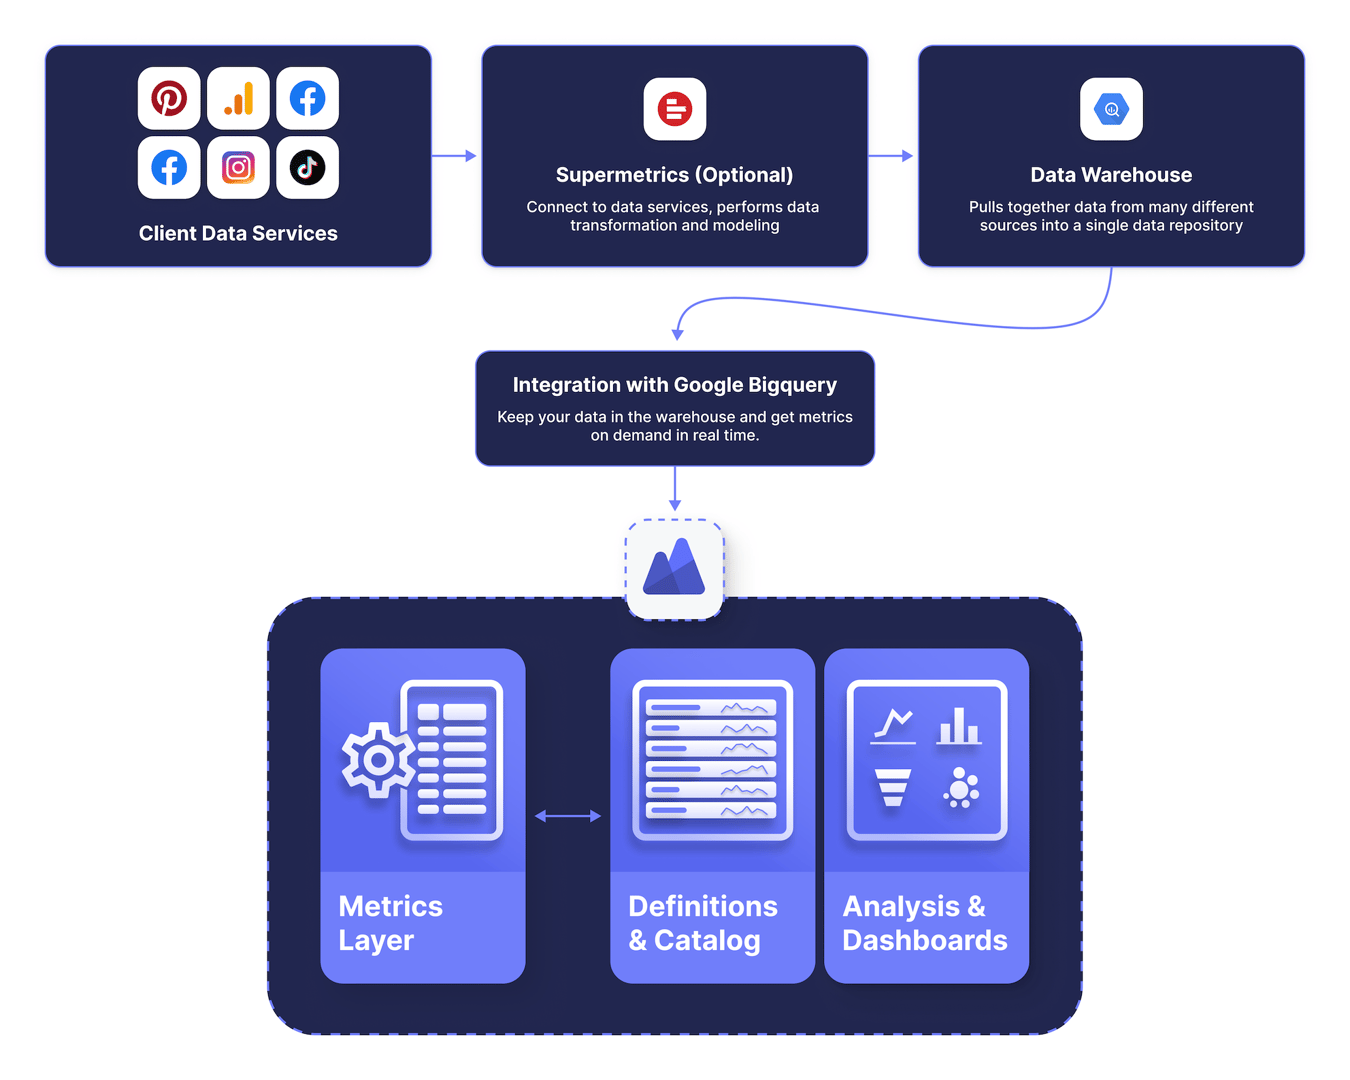
In our current setup, SuperMetrics ingests data into a Google BigQuery data warehouse, on top of which we’ve defined the metrics used in PowerMetrics. Having a Google BigQuery data warehouse has enabled us to not only efficiently store and deliver our data to PowerMetrics, it’s also allowed us to store more data and a larger variety of metrics and dimensions. In addition, the combination of BigQuery and PowerMetrics has made it much easier to blend datasets together and wall off client data.
We started out using Data Feeds in PowerMetrics but later transitioned to the Google BigQuery integration. Data Feeds combined our service account connections and our data as a visual component (a data feed) that worked like an information channel between our source data and our metrics. While data feeds may be a perfect solution for some organizations, we decided to move to the Google BigQuery integration for the following reasons: It’s highly scalable and enabled us to process larger volumes of data (only limited by the capacity of the data warehouse), no data is stored in PowerMetrics (data is queried directly from the warehouse and cached for a configurable duration of time in PowerMetrics) and we continued to be able to access metric data in real time. The PowerMetrics – Data Warehouse integration has become an integral part of our data solution, simultaneously allowing us to save time and deliver large volumes of data to our customers.
Earlier this year, we worked with the Klipfolio team to support beta testing of their Direct to Data Warehouse integration. Before implementing, the extremely large amount of data in our data warehouse meant adding metrics and then backfilling them in PowerMetrics, an arduous, lengthy process. The ability to directly query data in the warehouse and visualize it in PowerMetrics was a night and day change for us. The integration enables us to quickly, easily and reliably manage our data in the data warehouse and Klipfolio to lean into that warehouse and the work we do there. We’re very happy with this new integration and super grateful to the team at Klipfolio for all of their support during the transition!
Leaning on Klipfolio to support our expansion
When we started our reporting migration project in 2023, we were looking for a metric-centric data visualization partner for dynamic, modern-looking dashboards. We found what we were looking for and more when we discovered Klipfolio. As a partner, they’ve gone above and beyond our expectations. They not only take an interest in how their product is working, but how it’s working for us. They’re also always looking for ways to make things even better. We couldn’t be happier with our Klipfolio partnership or with the results we’ve seen so far.
We continue to explore ways to improve client reporting, for example, adding more metrics and dimensions for them to explore, more visualizations they can create and personalize, and more options for managing and manipulating their own data. As our portfolio of clients and services grow, we’ll continue to lean on Klipfolio to support our expansions and enhancements.
Troubleshooting issues with Klipfolio has been a smooth, easy process. Their support team is really responsive and their product team is always open to feedback and suggestions. They’ve listened to our concerns, added items to their roadmap and rapidly integrated new features and improvements into the platform. Klipfolio has been a supportive partner for us and our clients.
Learn more
To learn more about the PowerMetrics integration with Google BigQuery, read the docs or watch the video. PowerMetrics integrates with all major data warehouses, for example, Snowflake, Databricks, Microsoft Azure SQL, Amazon Redshift, PostgreSQL, and MariaDB, and the semantic layers from Cube and dbt Semantic Layer.
Related Articles

2025 BI and Analytics Trends for Small and Mid-Sized Businesses
By Allan Wille, Co-Founder — December 18th, 2024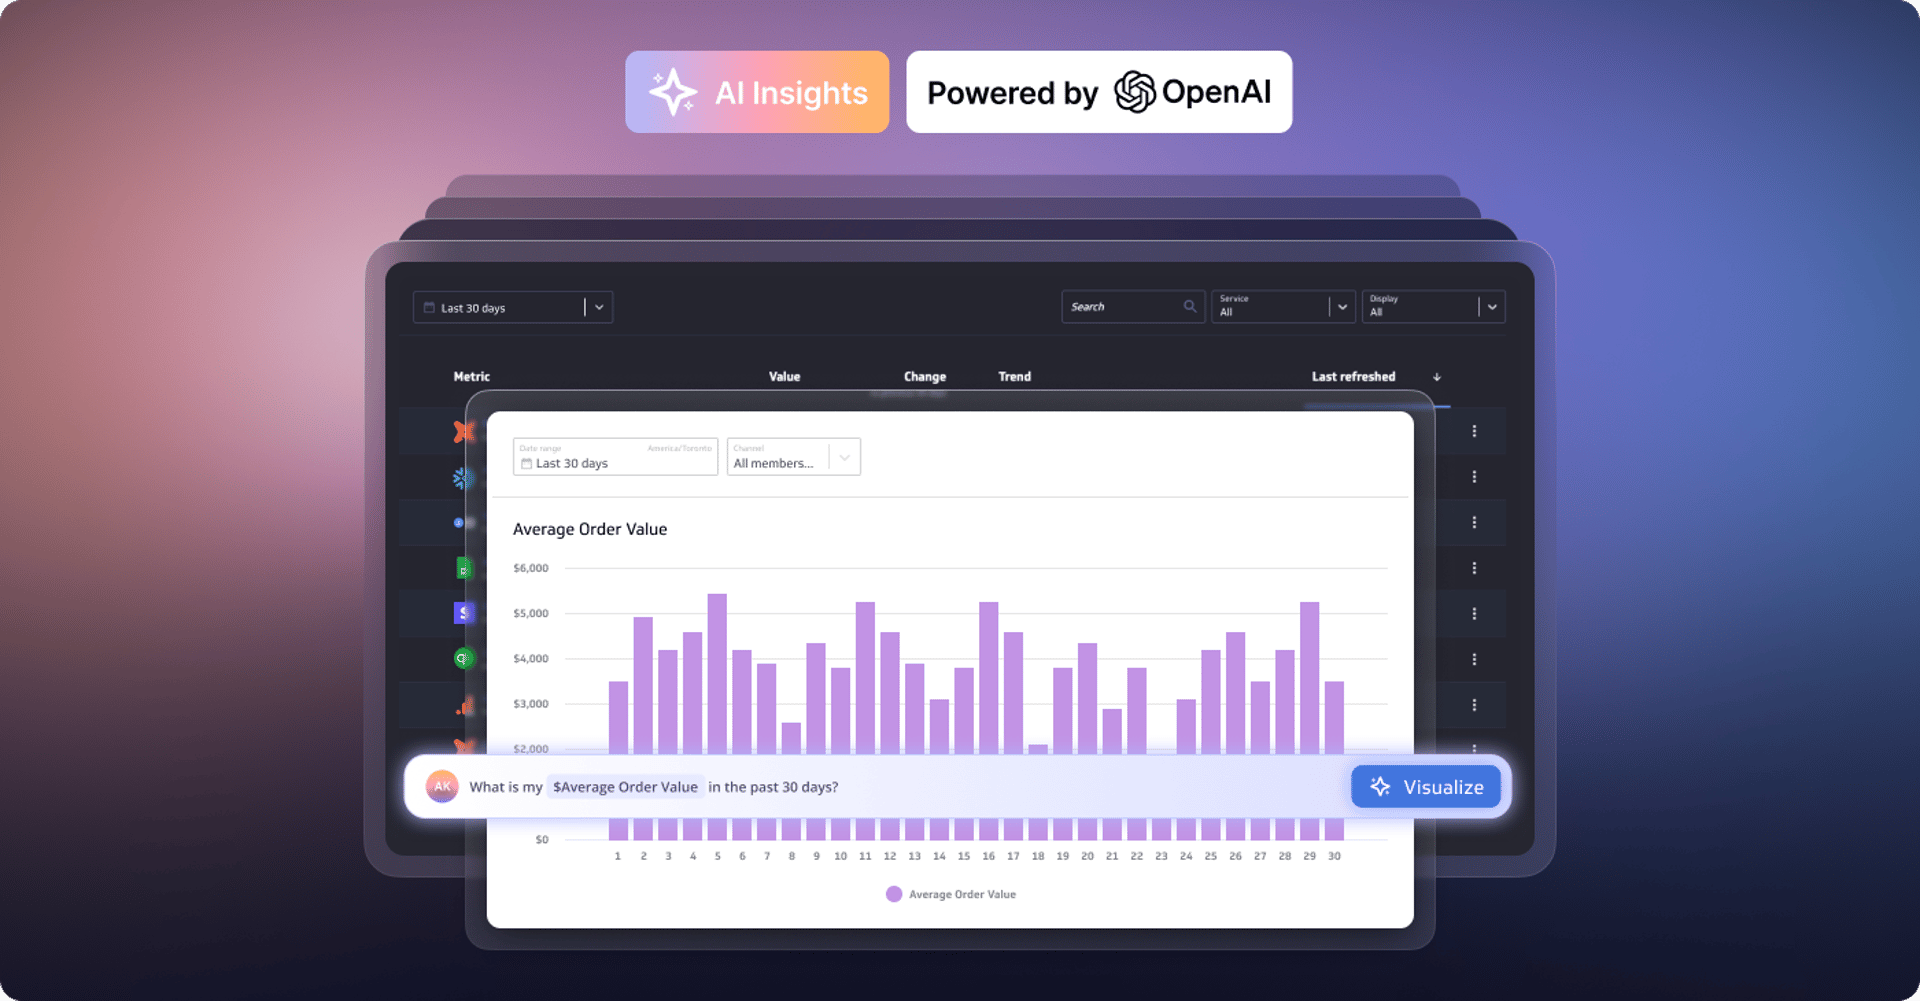
Metrics provide rich context for better AI: Introducing the new PowerMetrics AI experience
By David Mennie — June 21st, 2024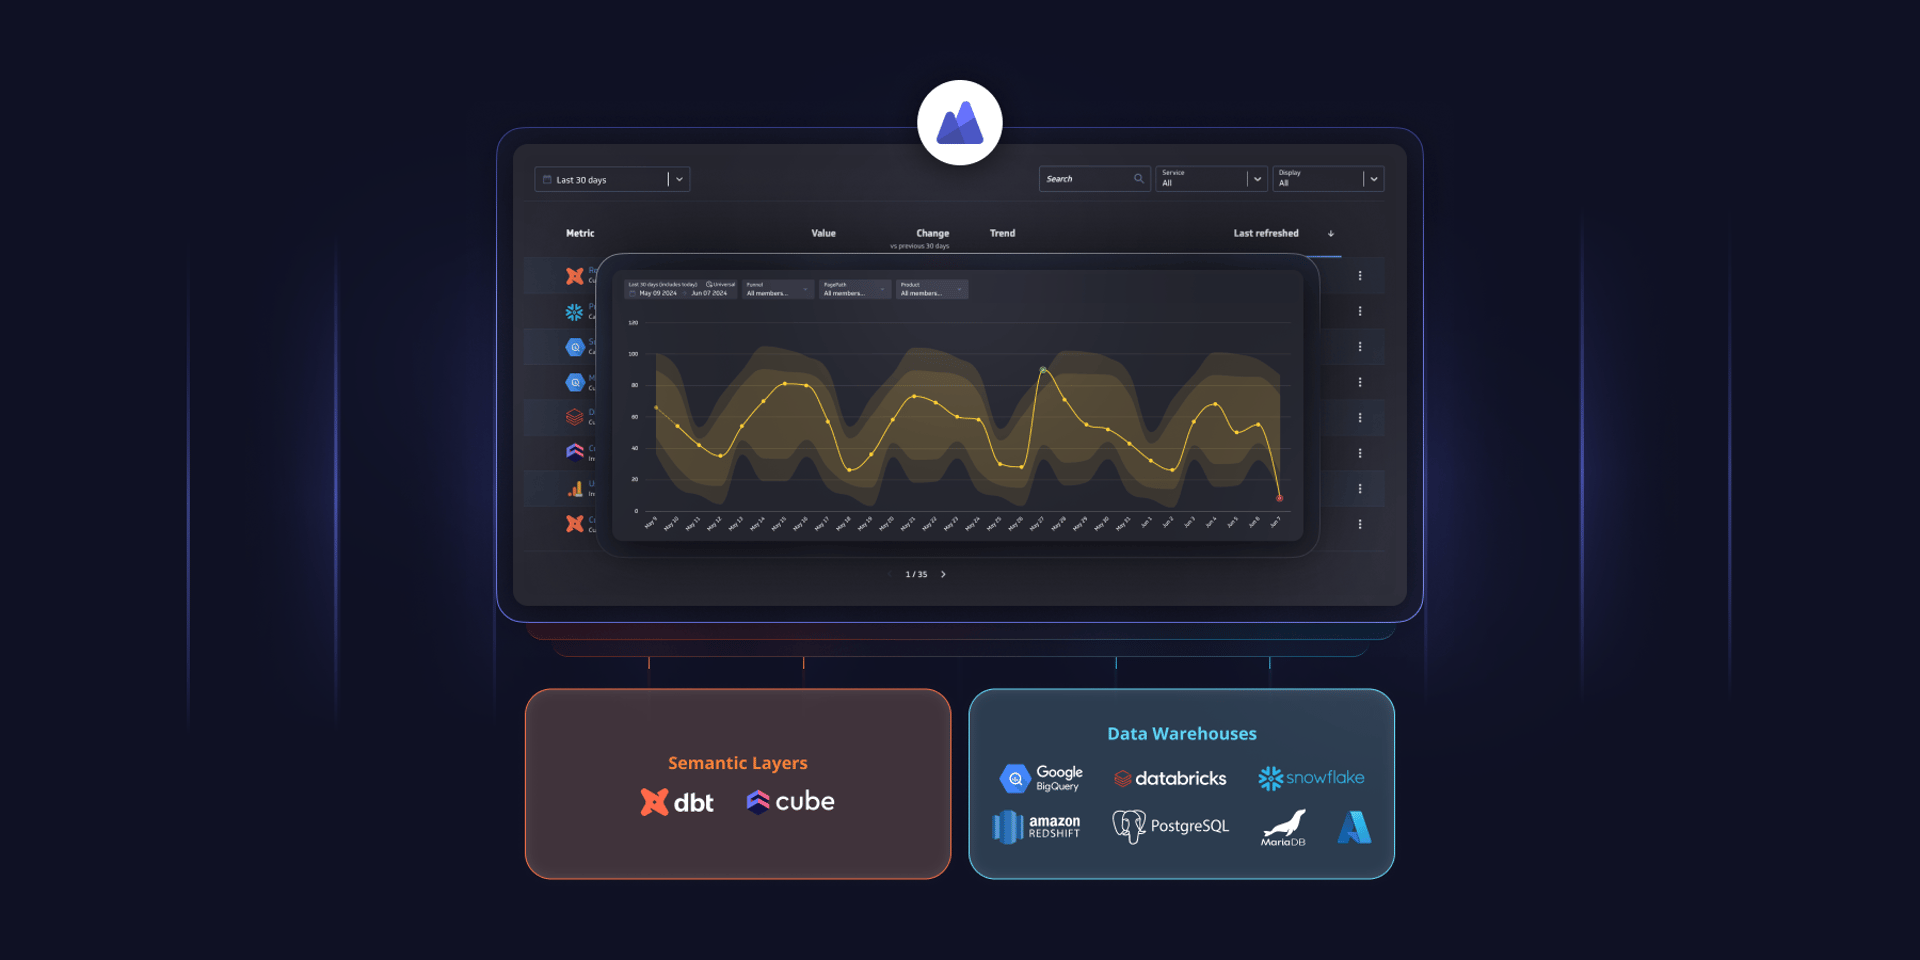
PowerMetrics - New data warehouse integrations and Cube semantic layer support
By David Mennie — June 14th, 2024