Customer Support Dashboard
Track tickets, response times, CSAT, and backlog to keep customers happy.
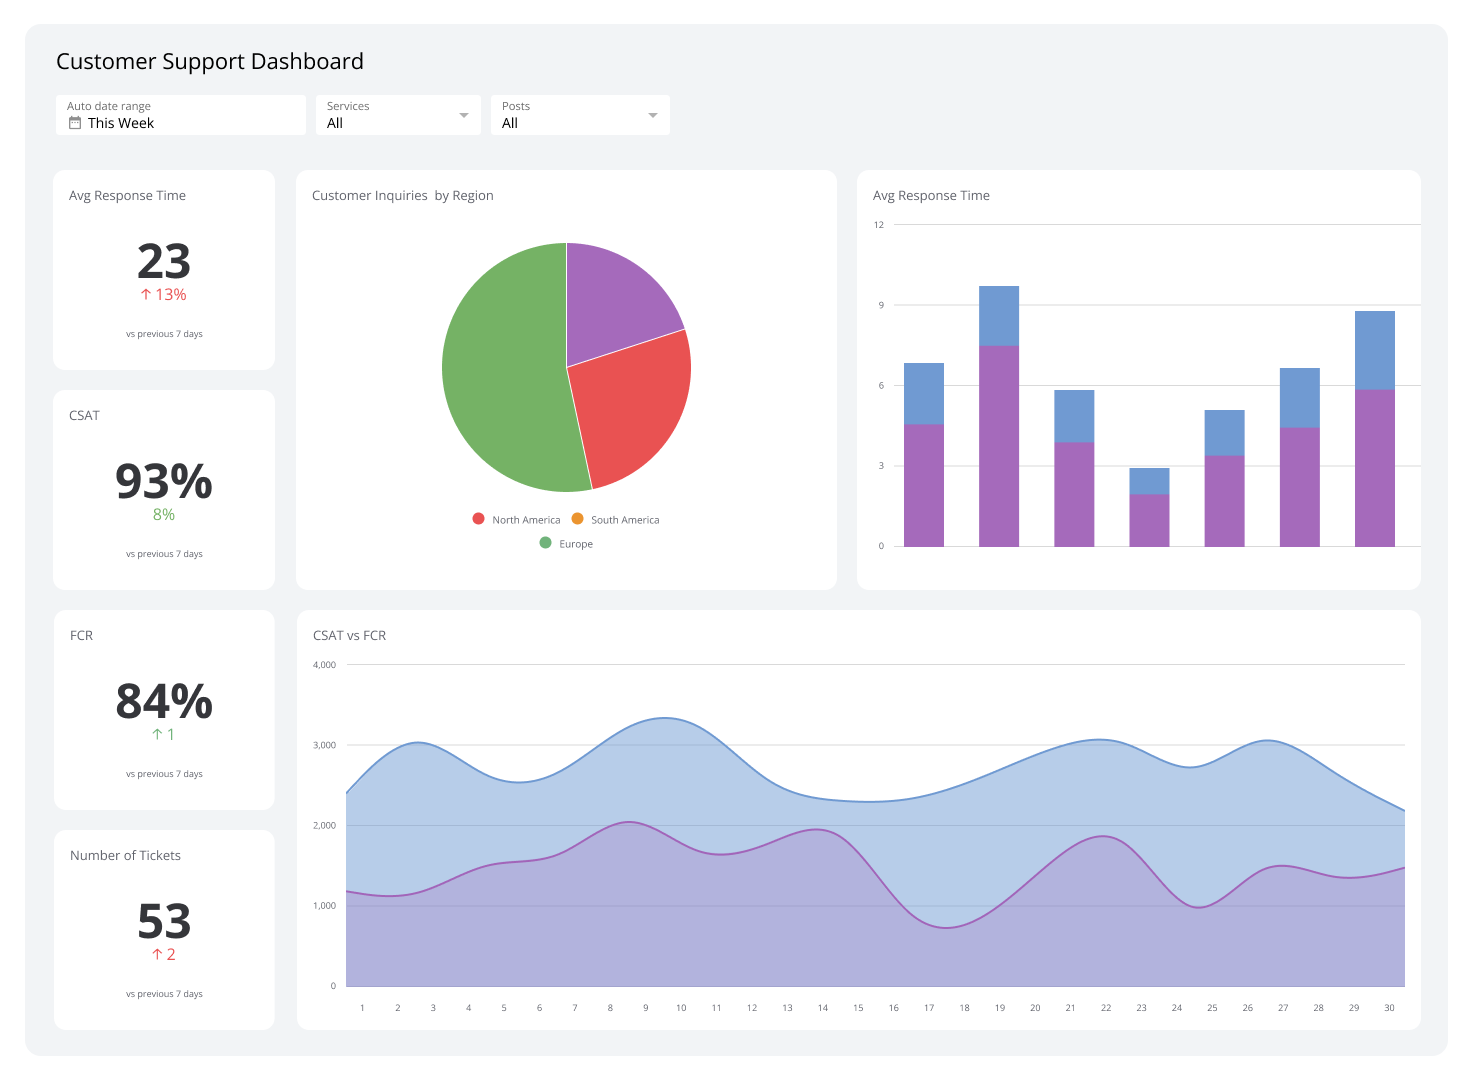
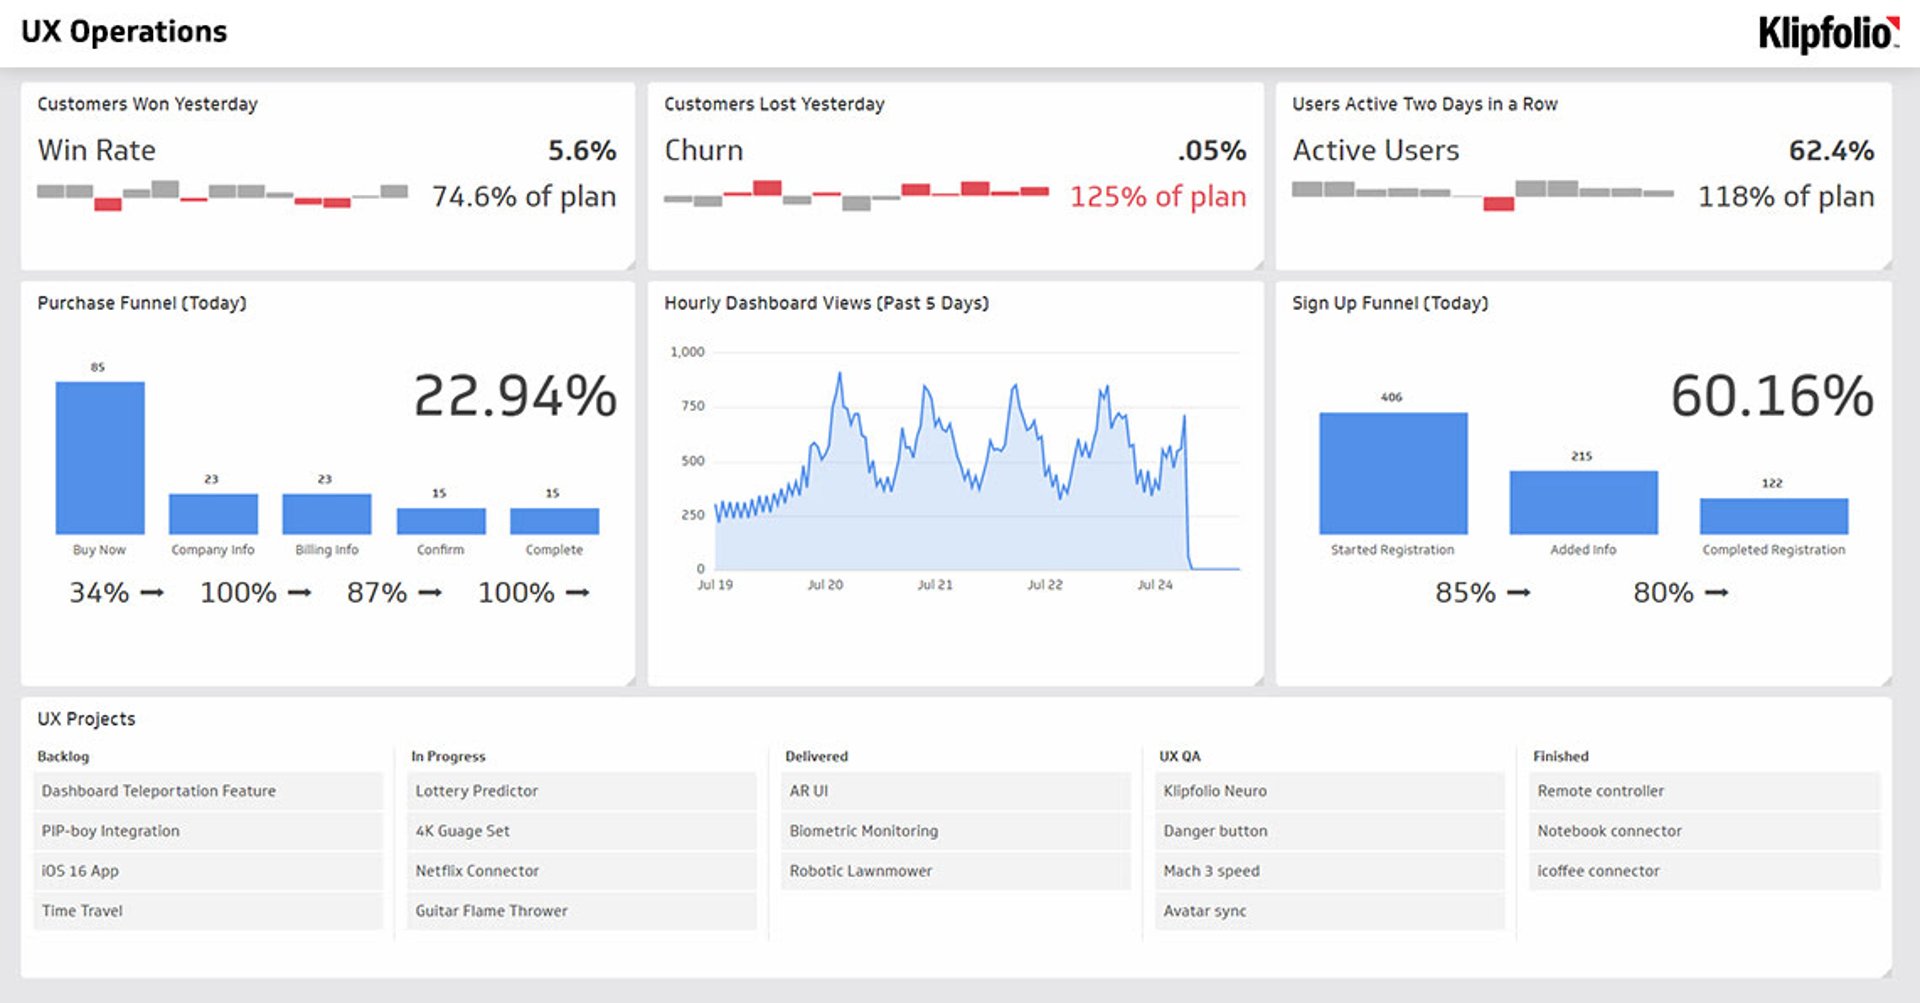
What is a Customer Support Dashboard?
A support dashboard is a dynamic, visual tool that gives real-time insights into customer support performance metrics and key performance indicators (KPIs). It helps you monitor and manage customer service efforts, ensuring timely responses and faster resolution of customer issues.
This SaaS dashboard typically includes metrics such as ticket volume, response times, resolution rates, customer satisfaction scores, and agent performance.
By providing a clear overview of the support team's performance, a support dashboard enables teams to identify improvement areas, improve workflows, allocate resources effectively, and enhance the customer experience.
A strong support team is key to any SaaS company’s success. The support tickets dashboard consolidates activity so you can track customer challenges, spot efficiency gaps, and keep up with client demand.
Zendesk
Connect Zendesk to your support tickets dashboard to measure the success of your customer service team and resource documents. Zendesk is part of your users’ product experience. It focuses on better communication and is even more effective when monitored in real time, because a strong product plus strong support makes a happy customer.
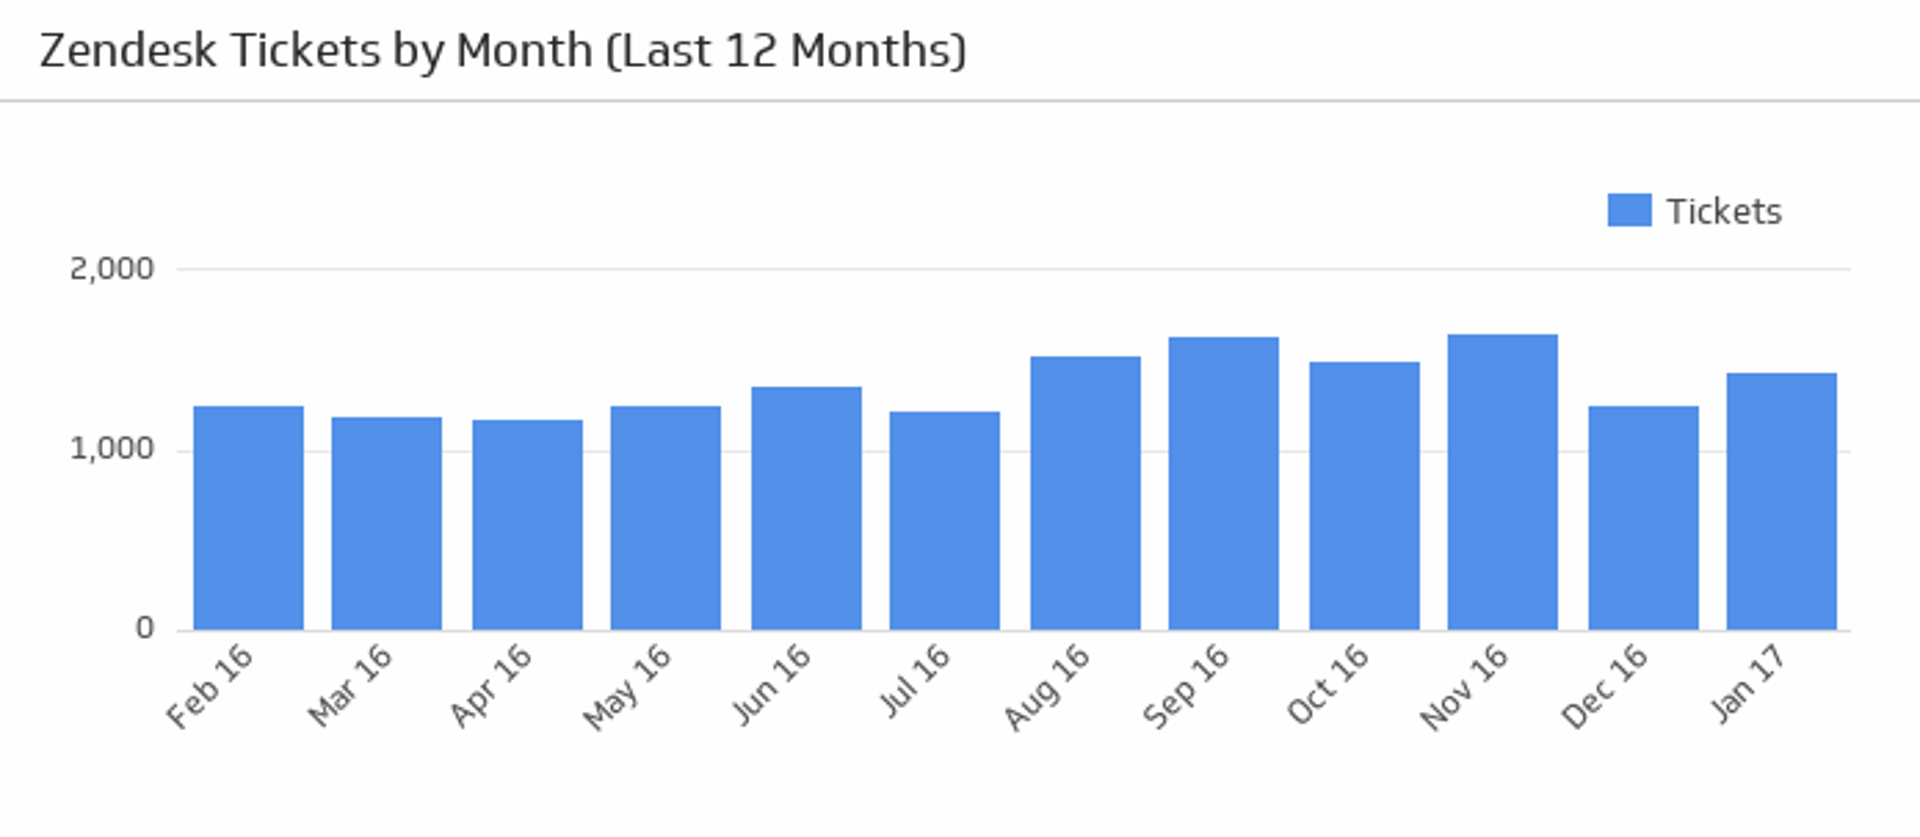
Tickets by Month
The Tickets by Month KPI shows the total number of tickets over the last twelve months. This metric helps you see how customers respond to product changes. It is also a starting point to assess support demand: if tickets jump beyond capacity, reorganize scheduling or add headcount.
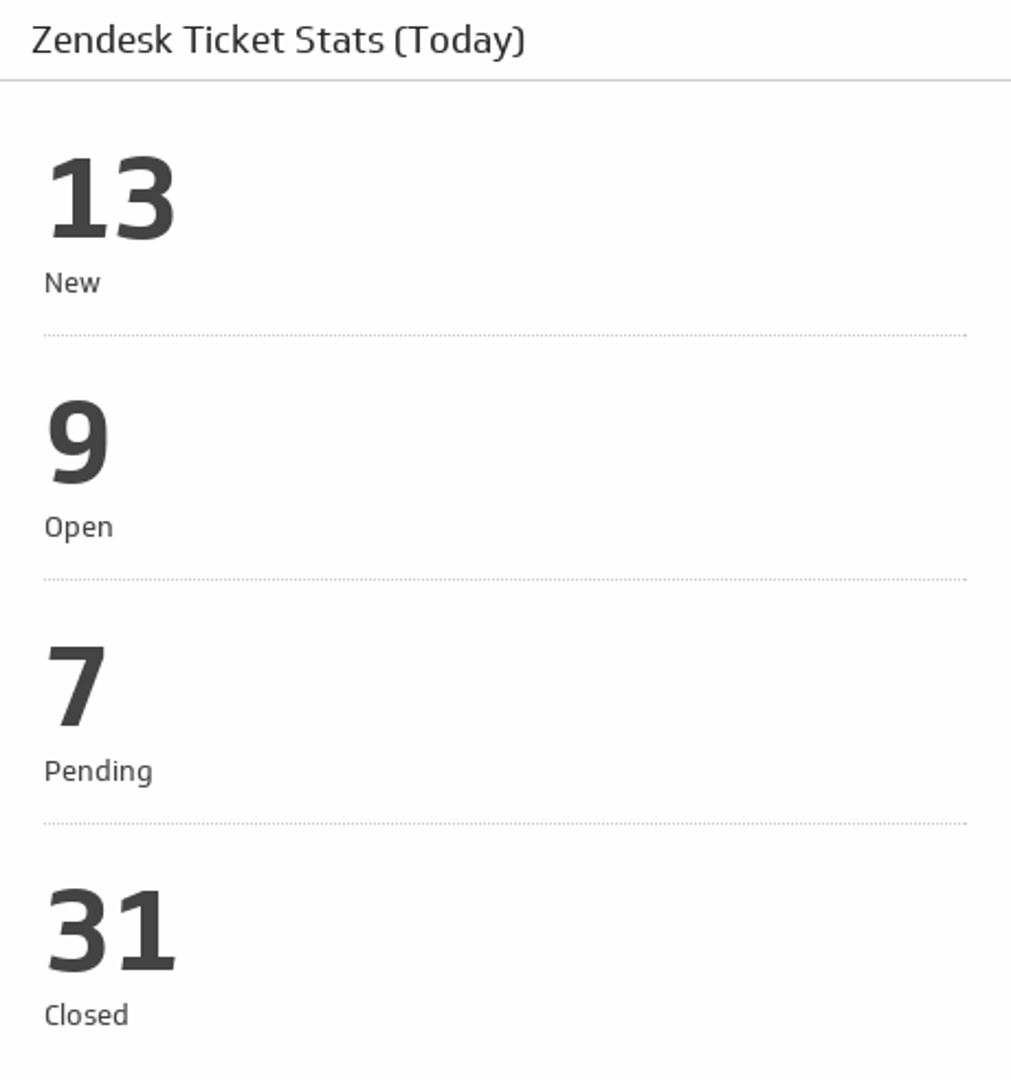
Ticket Stats (Today)
This support metric shows what representatives are doing in real time. Add it to see new, open, pending, and closed tickets as they occur. Many SaaS startups are all hands on deck in their early years. Train more than the support team so others can help when ticket volume spikes.
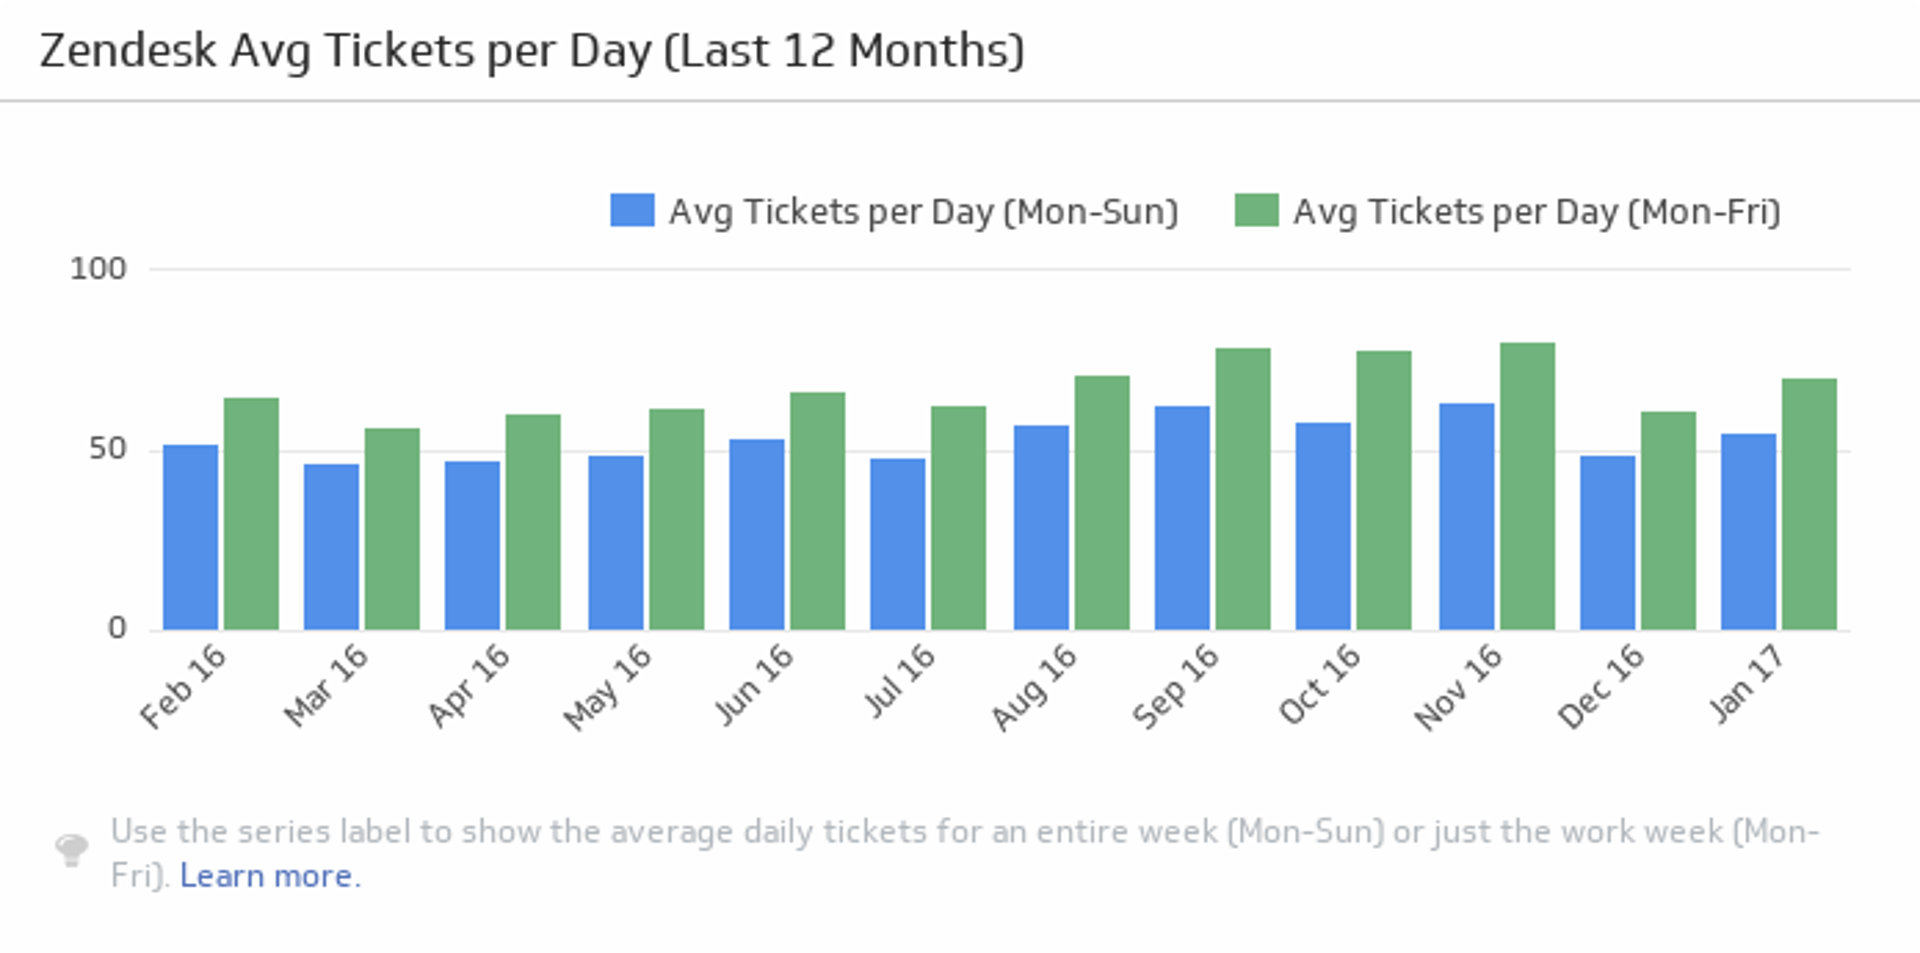
Average Tickets Per Day
This KPI monitors the average number of tickets per day over the past twelve months and compares five-day and seven-day monthly averages. Use it to evaluate team capacity and spot ticket trends. By breaking down tickets by day, you can make scheduling decisions so support is available when customers need it most.
CallRail
Phone support still matters. Hearing a human voice during a challenge can be the difference between adequate and great support. Add CallRail metrics to your support dashboard to foster an ongoing relationship between customers and your company. Track support call analytics to ensure customers receive the best service in the shortest time possible.
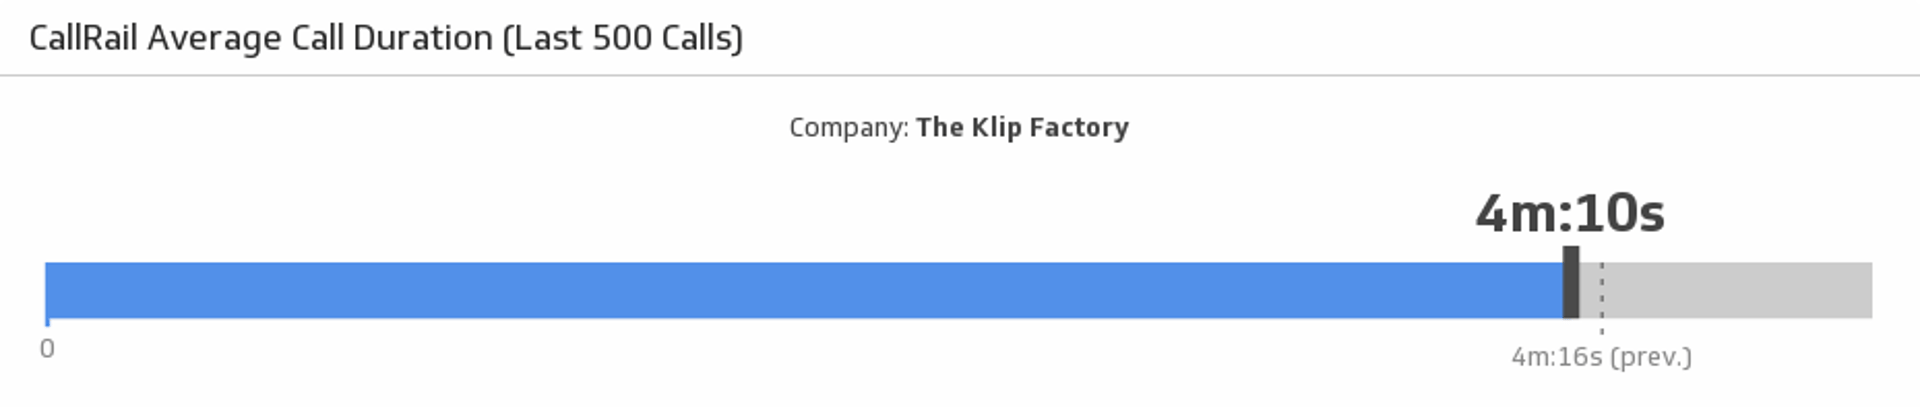
Average Call Duration (Last 500 Calls)
Average duration is both a satisfaction and efficiency metric. Short calls generally indicate quick resolutions. That’s not to say customers should not be thoroughly helped; it means representatives should be trained so efficient service complements quality support. Long calls can signal complex issues or training gaps. Add this metric to ensure customers spend less time on the phone and more time enjoying your product.
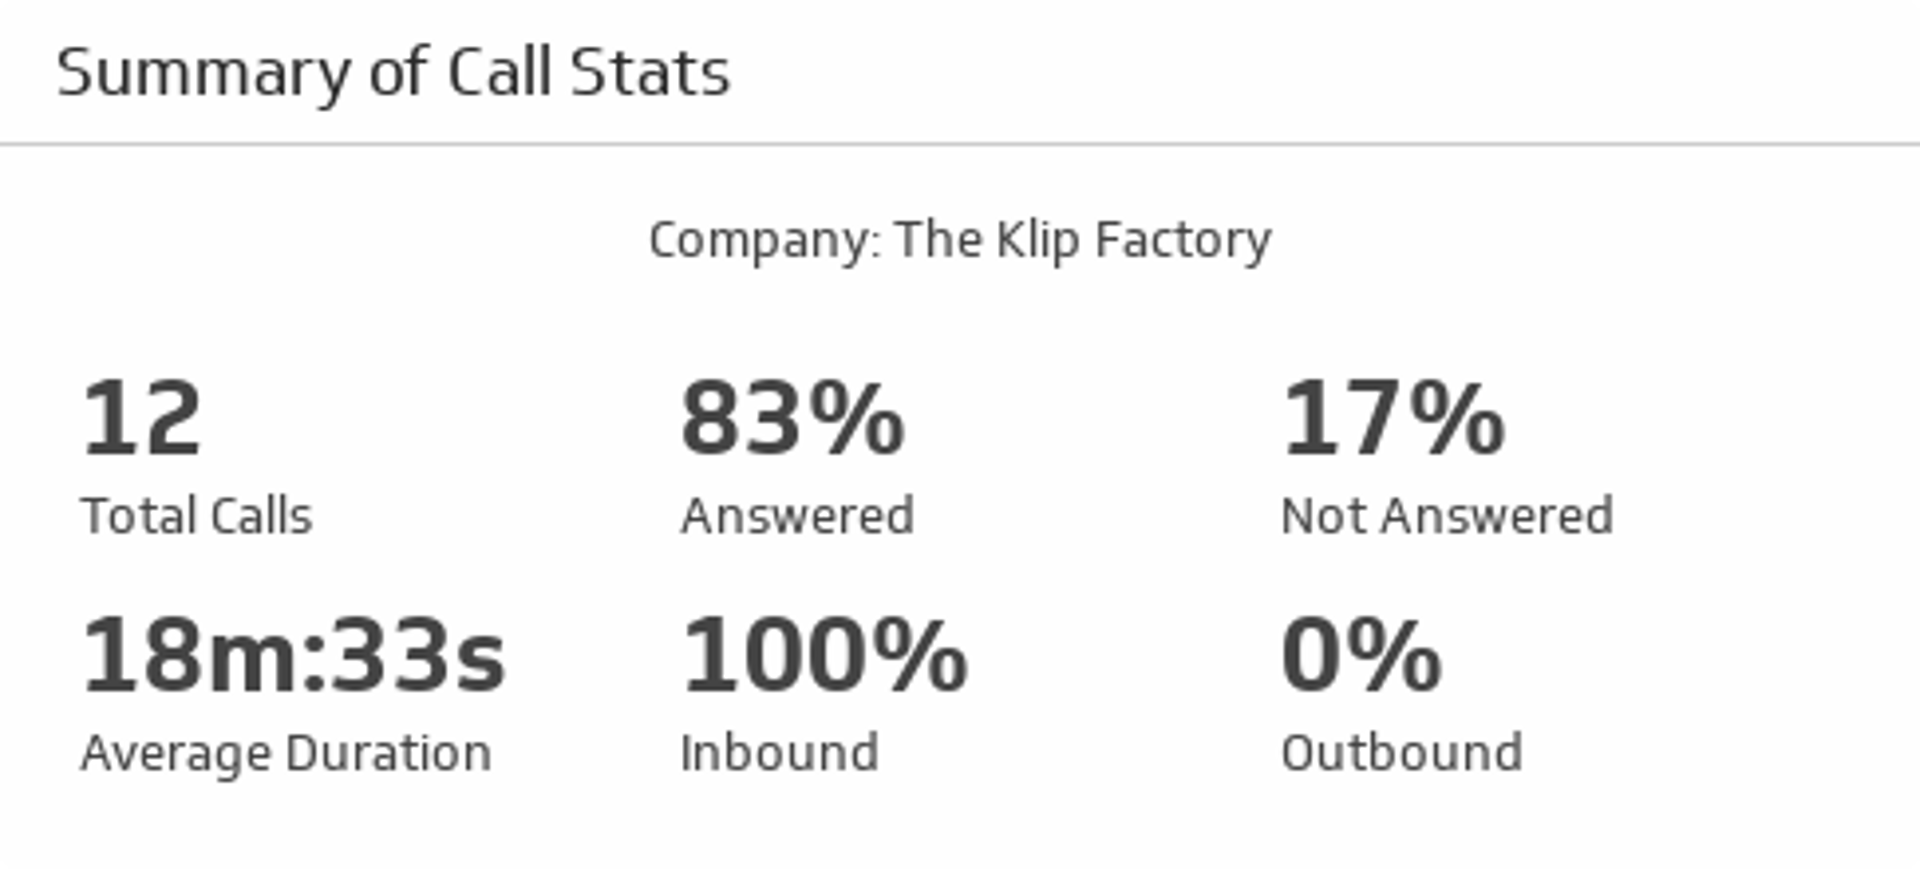
Summary of Call Stats
This metric covers the bases for teams that spend a lot of time on the phone. It monitors total calls, percentage answered, percentage unanswered, average duration, percentage inbound, and percentage outbound. One of its greatest values is sharing with managers and executives who make decisions based on support performance. The key to happy customers is being there when they need you. Aim for a call answered rate as close to 100% as possible.
Related Dashboards
View all dashboards