SaaS Growth Dashboard
Track MRR, churn, CAC, expansions, and account growth in one live SaaS view.
What is SaaS growth?
SaaS growth is the process of expanding a Software as a Service (SaaS) company by focusing on customer acquisition, revenue generation, market share, and product enhancement.
Common strategies include targeted marketing campaigns, customer retention programs, continuous product improvement, upsell and cross-sell motions, strategic partnerships, and improving key performance indicators like customer acquisition cost (CAC), churn rate, and net promoter score (NPS).
What is a SaaS Growth Dashboard?
A SaaS growth dashboard is a real-time analytics view that helps SaaS companies monitor and track growth metrics and key performance indicators (KPIs).
By visualizing data such as customer acquisition cost, revenue generation, churn rate, and customer lifetime value (CLV), you can make informed decisions, improve strategies, and accelerate growth.
This dashboard combines insights from marketing, sales, customer success, and product development, so teams can identify trends, measure progress, and adjust tactics to keep expansion on track.
As a monitoring tool that consolidates account and MRR data, a SaaS dashboard helps you understand performance across past, present, and future periods.
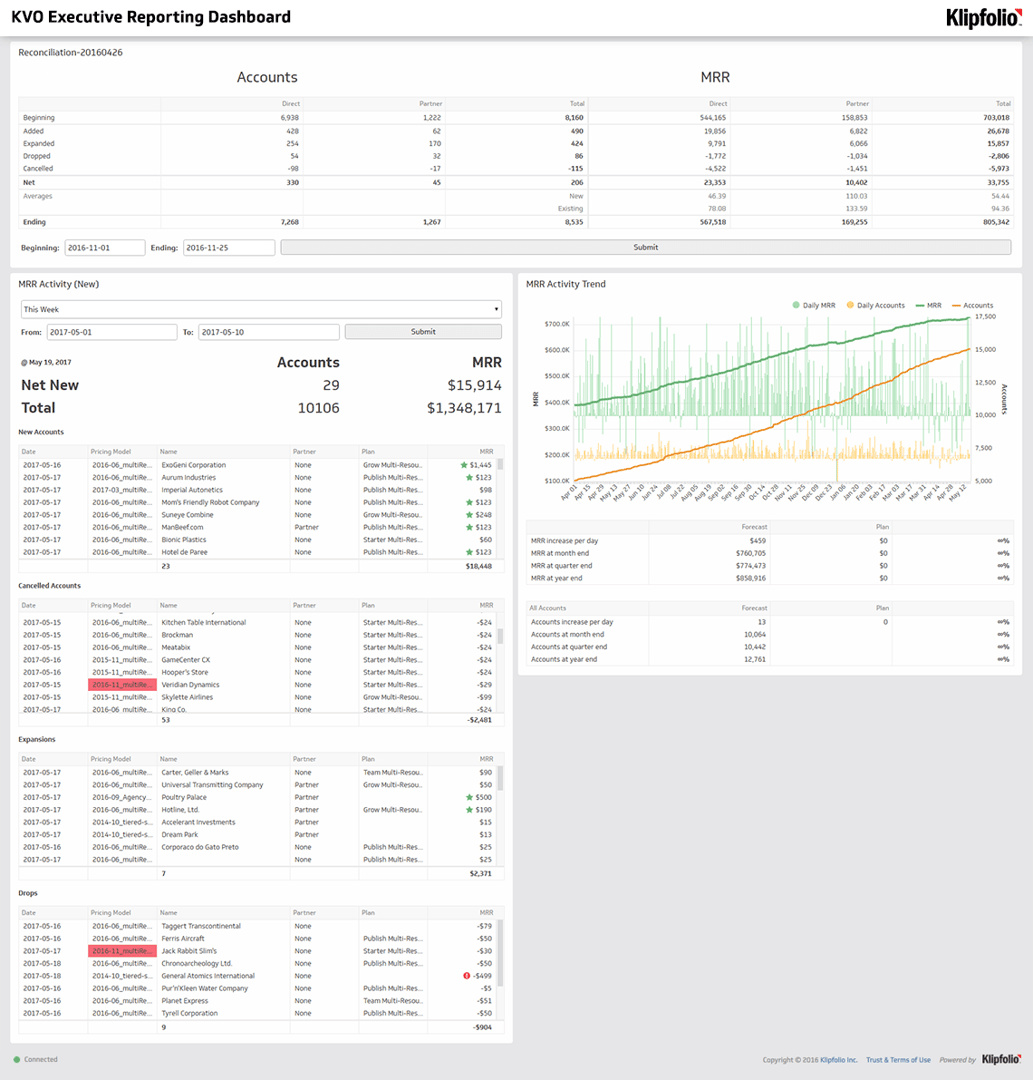
- Reconciliation of Accounts and MRR
- MRR Activity (New)
- MRR Activity Trend
Reconciliation of Accounts and MRR
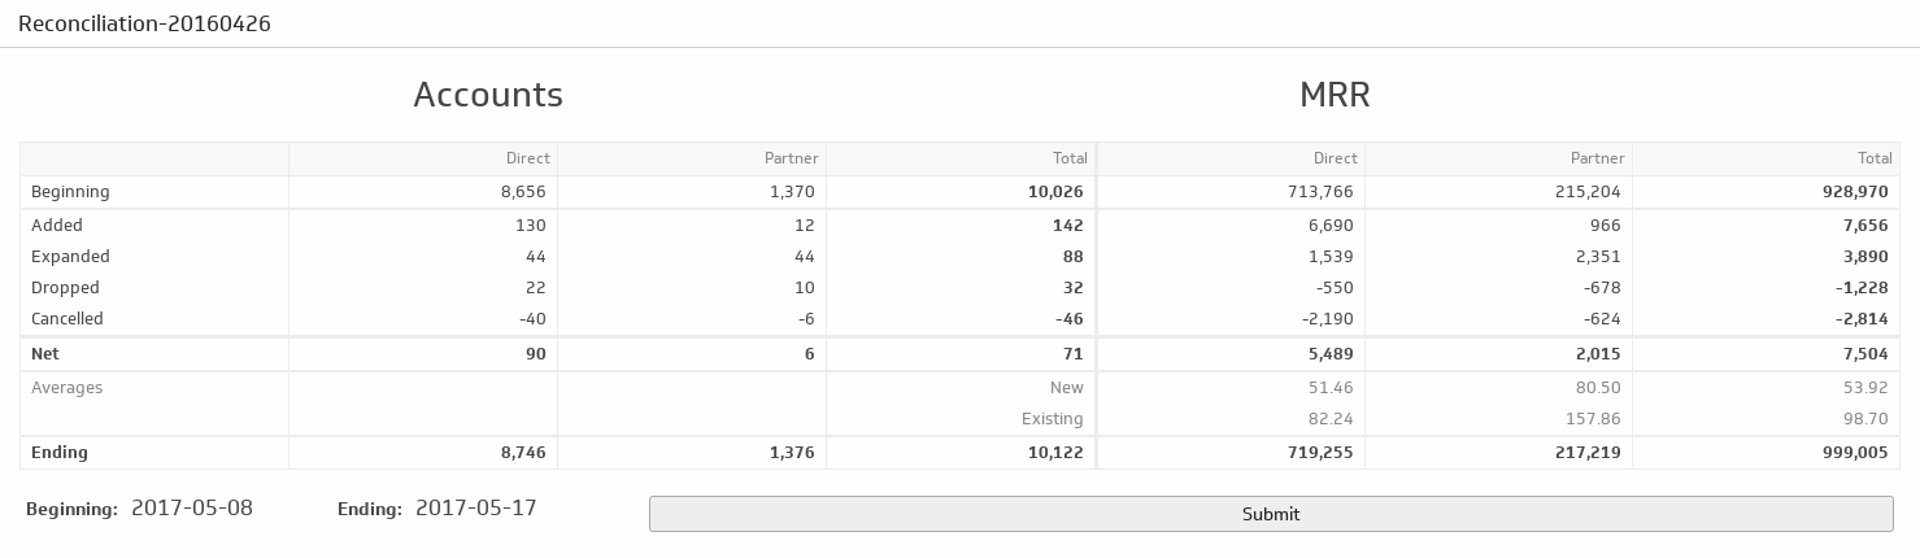
The four most important transactional details for a SaaS company are wins, expansions, cancellations, and drops.
Monthly Recurring Revenue (MRR) adds a dollar dimension to these transactions. Placing it beside accounts gives you a clear big-picture view. This view is broader than the other metrics on the dashboard, and it is the first stop when you want a quick read on what is happening.
MRR Activity
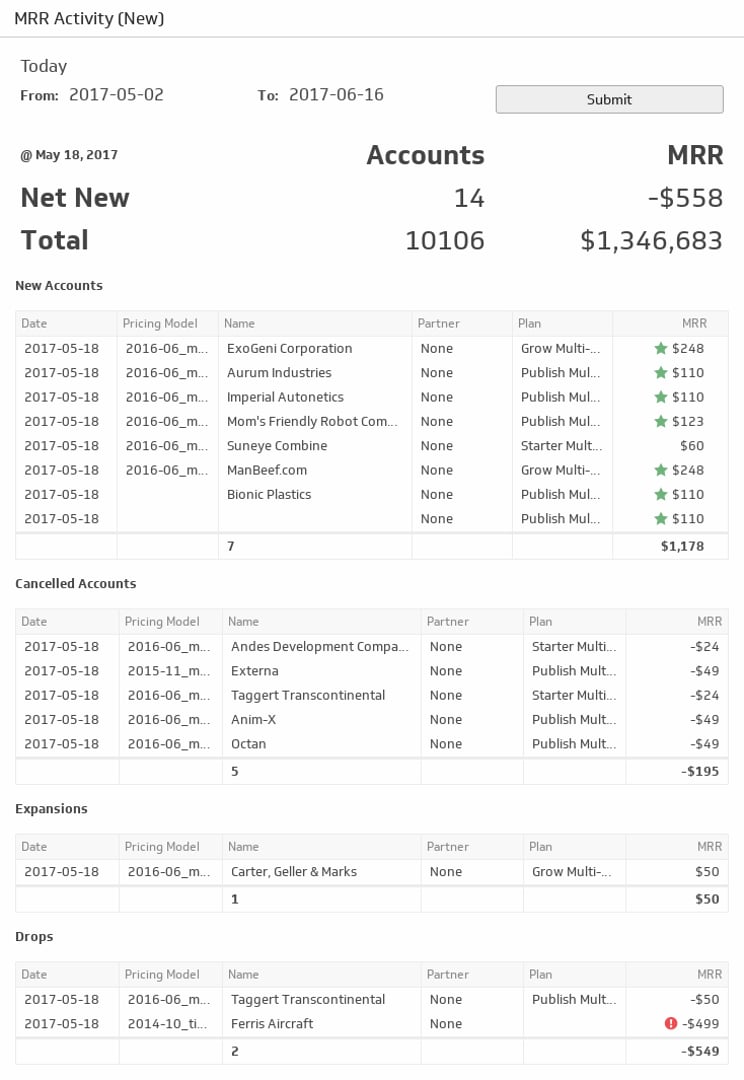
Granular views matter. Like the metric above, this one breaks down account and MRR data across the four key transactions, then goes deeper by customer or plan. Most SaaS companies use tiered pricing. Breaking results out by plan highlights where growth and risk concentrate. Adding simple icons can help your biggest accounts and biggest opportunities stand out.
MRR Activity Trend
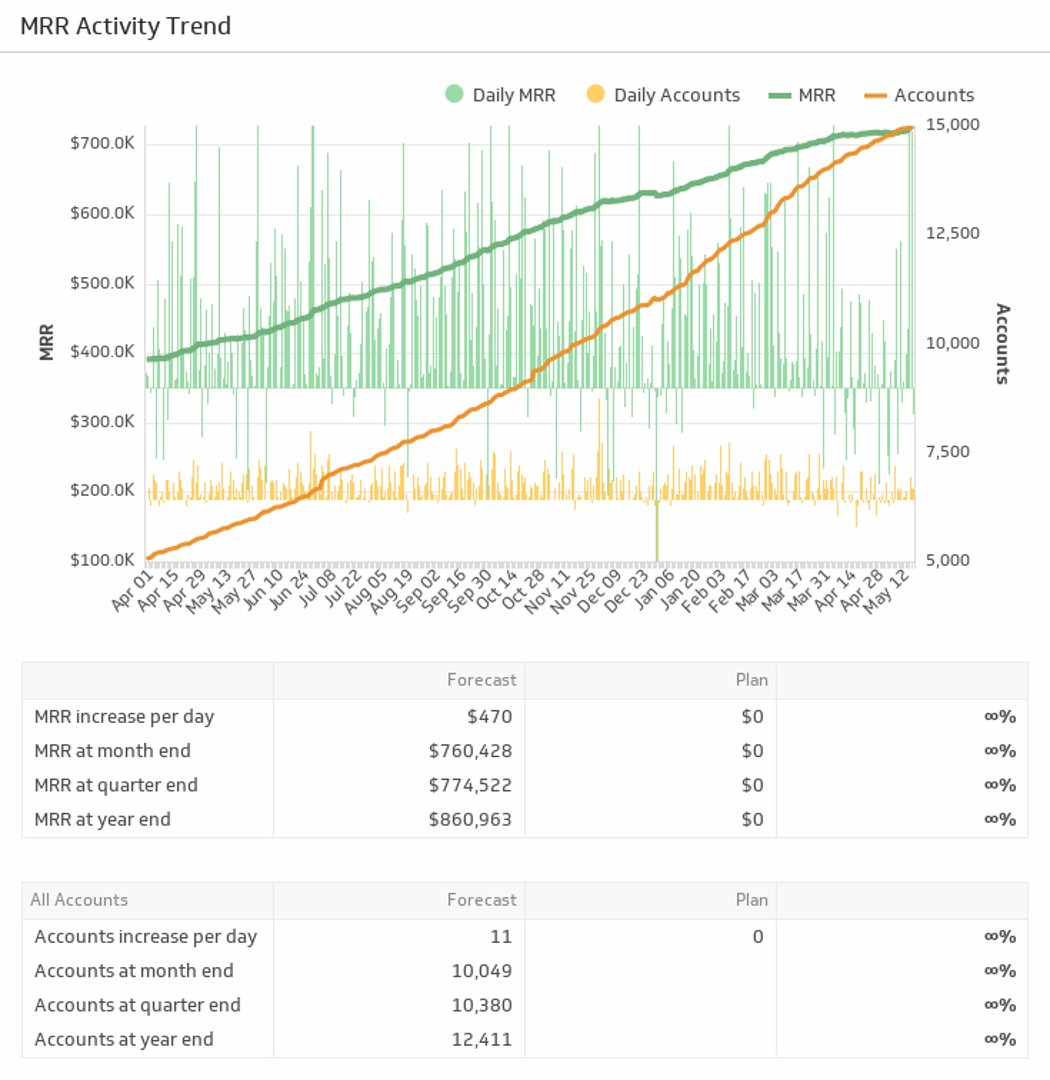
Start with the graph. It is the fastest way to see where you are accelerating or slowing. Use it to monitor net daily activity and spot days where cancellations or drops exceed wins or expansions. The goal is steady movement up and to the right.
The table below helps you track forecast and plan. Many teams find these projections reliable. If you are trending behind, adjust marketing or sales tactics, focus on expansion plays, or review onboarding to reduce churn. The aim is to adapt based on what the dashboard reveals.
Related Dashboards
View all dashboards