Recruitment Dashboard
A recruitment dashboard consolidates important hiring data into one place, allowing you to monitor and improve your recruitment efforts.
What is a Recruitment Dashboard?
Recruitment dashboards integrate data from job postings, applications, interviews, and offers to provide a complete, real-time view of your recruitment process. They let you observe and manage each stage of your hiring process more efficiently.
By providing a clear perspective on these metrics, they help you locate trends in your hiring process, like the stages where applicants tend to drop out and job listings that draw the best candidates.
A recruitment dashboard also facilitates more effective workplace planning by forecasting future hiring needs based on historical data. It can improve collaboration and communication between HR team members by offering a transparent snapshot of your recruitment procedures as well.
Examples of Recruitment Dashboards
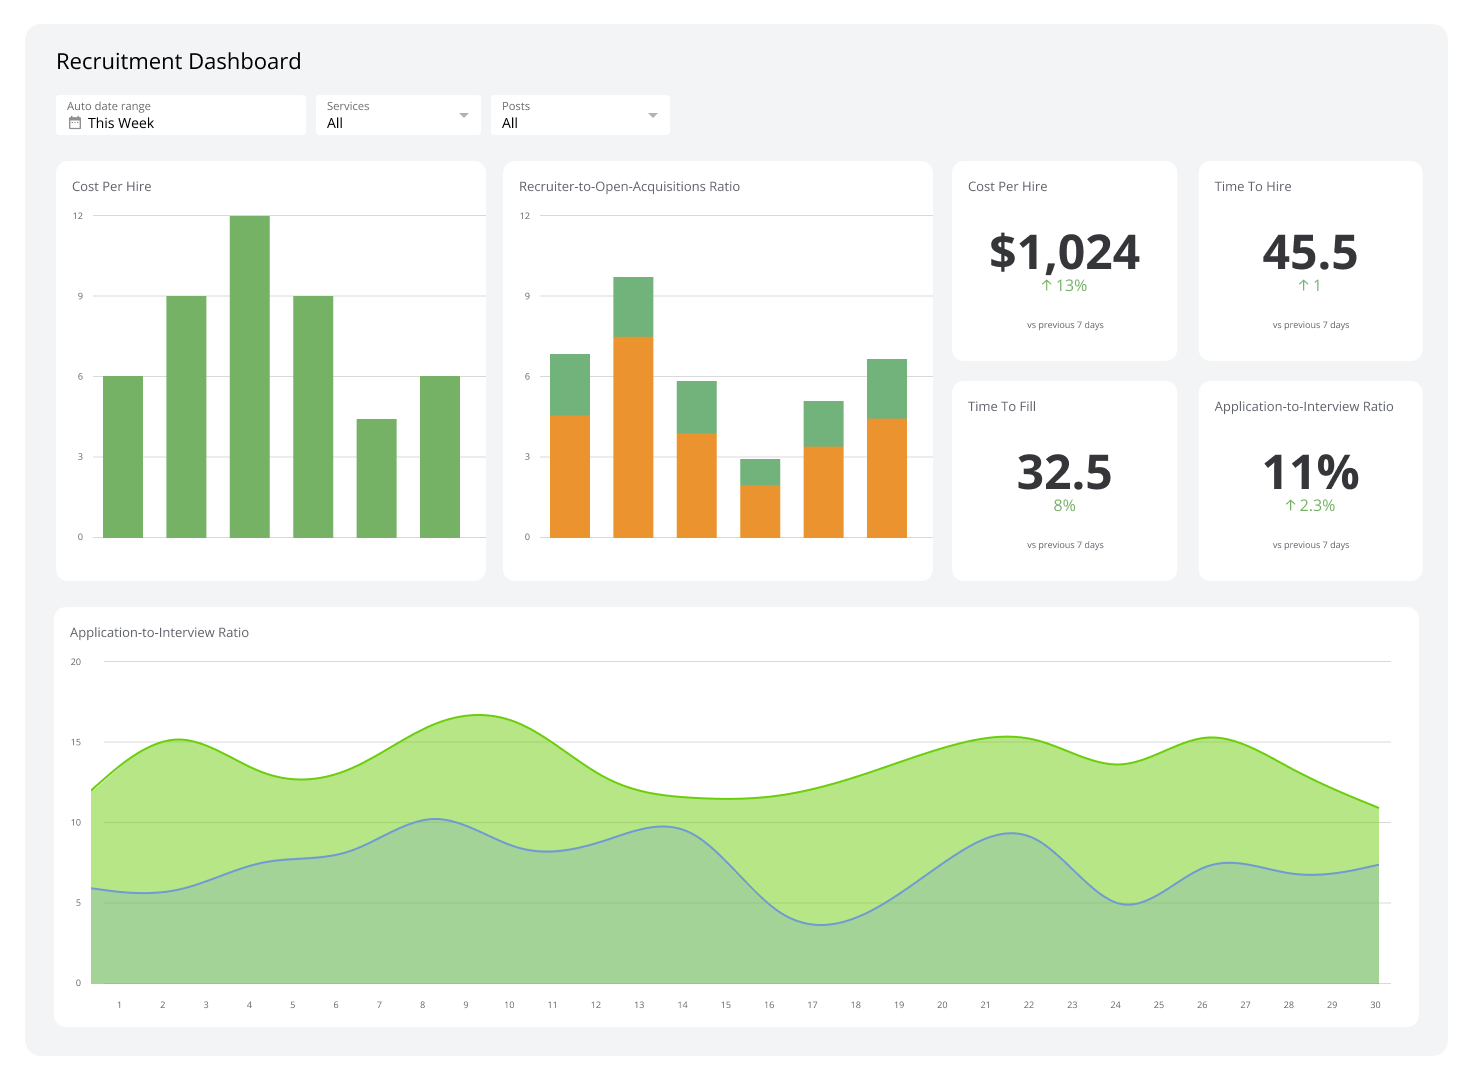
Recruitment Overview Dashboard
A recruitment overview dashboard provides the information needed to measure the efficiency and effectiveness of your recruitment process. It typically lets you know about inefficiencies in your hiring process, such as increased time to fill or declining candidate quality.
For example, this dashboard uses application rate data to reveal how many candidates applied over a specific period and pictures time-to-hire metrics, which let you break down each stage of the hiring process.
Who’s it for | HR managers, talent acquisition teams, hiring managers, recruiters, senior management, reporting analysts, business analysts, team leaders, quality assurance teams |
How often it's needed | Real-time, daily, weekly, monthly |
Covered KPIs | Number of job applications received, number of positions filled, application completion rate, time-to-hire, cost-per-hire, source of hire, candidate quality rating, job offer acceptance rate, candidate pipeline stages, interview-to-hire ratio, diversity metrics, job advertisement performance, candidate experience scores, referral program performance, recruiter activity metrics, hiring manager satisfaction scores, internal mobility rates, talent pool growth, background check completion time, new hire retention rates, employee onboarding time, recruitment campaign effectiveness, job offer turnaround time, candidate feedback comments, rejection reasons, recruitment efficiency index |
Sourcing Dashboard
Sourcing dashboards can identify low yields of quality candidates, diversity imbalances, and other inefficiencies in sourcing. Their data can tell you when to shift or optimize your sourcing strategies to make them more effective at acquiring new talent. Also, they visualize candidate quality, which can help you better understand the impact of your sourcing methods.
Who’s it for | Team leaders, HR managers, business analysts, recruiters, quality assurance teams, sourcing specialists, talent acquisition teams, reporting analysts, hiring managers |
How often it's needed | Real-time, daily, weekly, monthly |
Covered KPIs | Sourcing channel performance, number of applications per source, cost per source, candidate quality by source, time-to-fill by source, conversion rate from source, source effectiveness ratio, candidate engagement by source, referral source effectiveness, diversity of candidates by source, source of hire by role, candidate drop-off rate by source, social media recruiting metrics, job board performance, source lead-to-hire ratio, pipeline contribution by source, candidate experience by source, offer acceptance rate by source, sourcing campaign ROI, percentage of hires by source, hiring manager satisfaction by source, proactive sourcing interaction rate, candidate retention by source, application-to-interview ratio by source |
Offer Acceptance Rate Dashboard
An offer acceptance rate dashboard paints a clear picture of how many job offers your company makes and how many of those offers are accepted by candidates. It divides this data by job roles, departments, and hiring managers to show you where your hiring procedures are strongest and where improvements can be made to boost your acceptance rates.
Thanks to this dashboard, it’s possible to pinpoint patterns, such as tech positions having a lower offer acceptance rate than marketing roles. In most scenarios, this points to concerns about the attractiveness of your business’s tech roles, like low salaries or inferior benefits.
Who’s it for | Recruitment coordinators, business analysts, talent acquisition teams, reporting analysts, HR managers, hiring managers, team leaders, department heads, recruiters |
How often it's needed | Real-time, daily, weekly, monthly |
Covered KPIs | Job offer acceptance rate, offer decline reasons, time-to-acceptance, acceptance rates by position, acceptance rates by department, candidate satisfaction with offer process, compensation package effectiveness, competitive offer analysis, acceptance rate by recruiter, offer negotiations rate, impact of company brand on acceptance, candidate feedback on offers, cost per accepted offer, effectiveness of signing bonuses, acceptance rate by candidate source, geographic acceptance trends, offer rescind rate |
Recruitment Funnel Dashboard
A recruitment funnel dashboard showcases the progression of your candidates through each recruitment stage using metrics like offer rates and acceptance rates. It also shows conversion rates and drop-off points to help you understand the areas where candidates are frequently lost.
In addition, this dashboard helps identify bottlenecks, such as delays between interview stages or inefficient communication practices. By being aware of such issues, you can take appropriate measures to reduce delays in communication and enhance the overall hiring experience.
Who’s it for | HR managers, reporting analysts, team leaders, recruiters, hiring managers, business analysts, talent acquisition teams, sourcing specialists, quality assurance teams |
How often it's needed | Real-time, daily, weekly, monthly |
Covered KPIs | Number of applicants, applications received per vacancy, screening rate, interview rate, offer rate, acceptance rate, hire rate, time-to-hire, time-to-fill, candidate drop-off rate, cost-per-hire, quality-of-hire, sourcing channel performance, candidate experience scores, referral rate, applicant conversion rate, job posting effectiveness, pipeline efficiency, interview-to-offer ratio, offer-to-acceptance ratio, demographic metrics, diversity metrics, application completion rate, rejection reasons, applicant source breakdown |
Recruitment Team Performance Dashboard
Recruitment team performance dashboards give you a comprehensive view of your recruitment team’s effectiveness by monitoring their productivity and success rates. Common metrics and KPIs they display include number of applicants screened, interviews arranged, offers extended, time-to-hire, and recruiter performance.
They also supply insights into job fill rates and recruiter activities to reveal areas of improvement and strength within the team.
Who’s it for | HR managers, business analysts, team leaders, recruiters, quality assurance teams, talent acquisition teams, reporting analysts, hiring managers, sourcing specialists |
How often it's needed | Real-time, daily, weekly, monthly |
Covered KPIs | Number of applicants screened, interviews arranged, offers extended, offers accepted, hires made, time-to-hire, time-to-fill, applicant-to-hire ratio, source-of-hire effectiveness, candidate experience scores, recruiter productivity, cost-per-hire, quality-of-hire, passive candidate conversion rate, recruitment funnel efficiency, candidate feedback comments, job match quality, interview-to-offer ratio, offer-to-acceptance ratio, pipeline velocity, recruiter training completion rates, recruitment marketing effectiveness, diversity hiring metrics, candidate rejection reasons, external vs. internal recruitment success, top recruiter performance, teamwork efficiency, onboarding success rates, recruitment team performance index |
Individual Recruitment Performance Dashboard
An individual recruitment performance dashboard provides a detailed analysis of your recruiters’ performance, showing their skill at finding and hiring candidates. It discloses which recruiters are underperforming through metrics and KPIs like the time-to-hire and candidate satisfaction scores. More importantly, it displays a detailed overview of the conversion rates from contacts to hires, letting you match more suitable candidates with your open positions.
Who’s it for | Hiring managers, recruiters, sourcing specialists, team leaders, HR managers, talent acquisition teams, reporting analysts, quality assurance teams, business analysts |
How often it's needed | Real-time, daily, weekly, monthly |
Covered KPIs | Number of applicants screened, interviews arranged, offers extended, offers accepted, hires made, time-to-hire, time-to-fill, applicant-to-hire ratio, source-of-hire effectiveness, candidate experience scores, recruiter productivity, cost-per-hire, quality-of-hire, passive candidate conversion rate, recruitment funnel efficiency, candidate feedback comments, job match quality, interview-to-offer ratio, offer-to-acceptance ratio, pipeline velocity, recruiter training completion rates, recruitment marketing effectiveness, diversity hiring metrics, candidate rejection reasons, external vs. internal recruitment success, top recruiter performance, teamwork efficiency, onboarding success rates |
Open Position and New Roles Dashboard
Open position and new roles dashboards report the status and progress of all job openings in your company. They show the number of open positions, application trends, and the stages of the recruitment process for each role. This dashboard helps you identify difficult-to-fill roles, highlight discrepancies in hiring times, and understand how new roles are being created and filled.
Who’s it for | Recruiters, hiring managers, talent acquisition teams, HR managers, business analysts, reporting analysts, team leaders, recruitment coordinators, department heads |
How often it's needed | Real-time, daily, weekly, monthly |
Covered KPIs | Number of open positions, time-to-fill open roles, candidate pipeline status, job requisition aging, applicant volume per role, offer acceptance rates, recruitment advertising effectiveness, internal vs. external hire ratios, diversity of candidate pool, detailed role descriptions status, interview scheduling efficiency, candidate feedback scores, sourcing channel effectiveness, time-to-post jobs, recruitment communication timelines, onboarding progress for new roles, alignment of hires with business objectives, role-specific vacancy trends, urgency of role fulfillment, impact of employer branding on candidate attraction, recruitment budget allocations, overall job market competitiveness analysis |
Applicant Tracking Dashboard
Applicant tracking dashboards display an organized view of your recruitment procedures by monitoring candidate progress through different hiring stages. The metrics and KPIs they generate show the figures behind your number of applicants, screening progress, interview stages, and application outcomes. Applying the data from this dashboard exposes improvement areas in candidate evaluation by recognizing stages where applicants repeatedly drop off or where delays occur.
Who’s it for | HR managers, talent acquisition teams, team leaders, business analysts, recruitment coordinators, reporting analysts, recruiters, department heads, hiring managers |
How often it's needed | Real-time, daily, weekly, monthly |
Covered KPIs | Number of applications received, application-to-interview ratio, interview-to-offer ratio, time-to-hire, candidate pipeline status, offer acceptance rate, applicant source effectiveness, candidate experience scores, job offer decline reasons, recruitment advertising ROI, internal vs. external hire statistics, application completion rate, requisition fulfillment time, recruitment workflow efficiency, candidate feedback ratings, diversity of applicant pool, hiring manager satisfaction rate, interview scheduling efficiency, background check completion time, onboarding initiation speed, recruitment process compliance, candidate dropout rate, referral program effectiveness, ATS usage metrics, role-specific applicant trends |
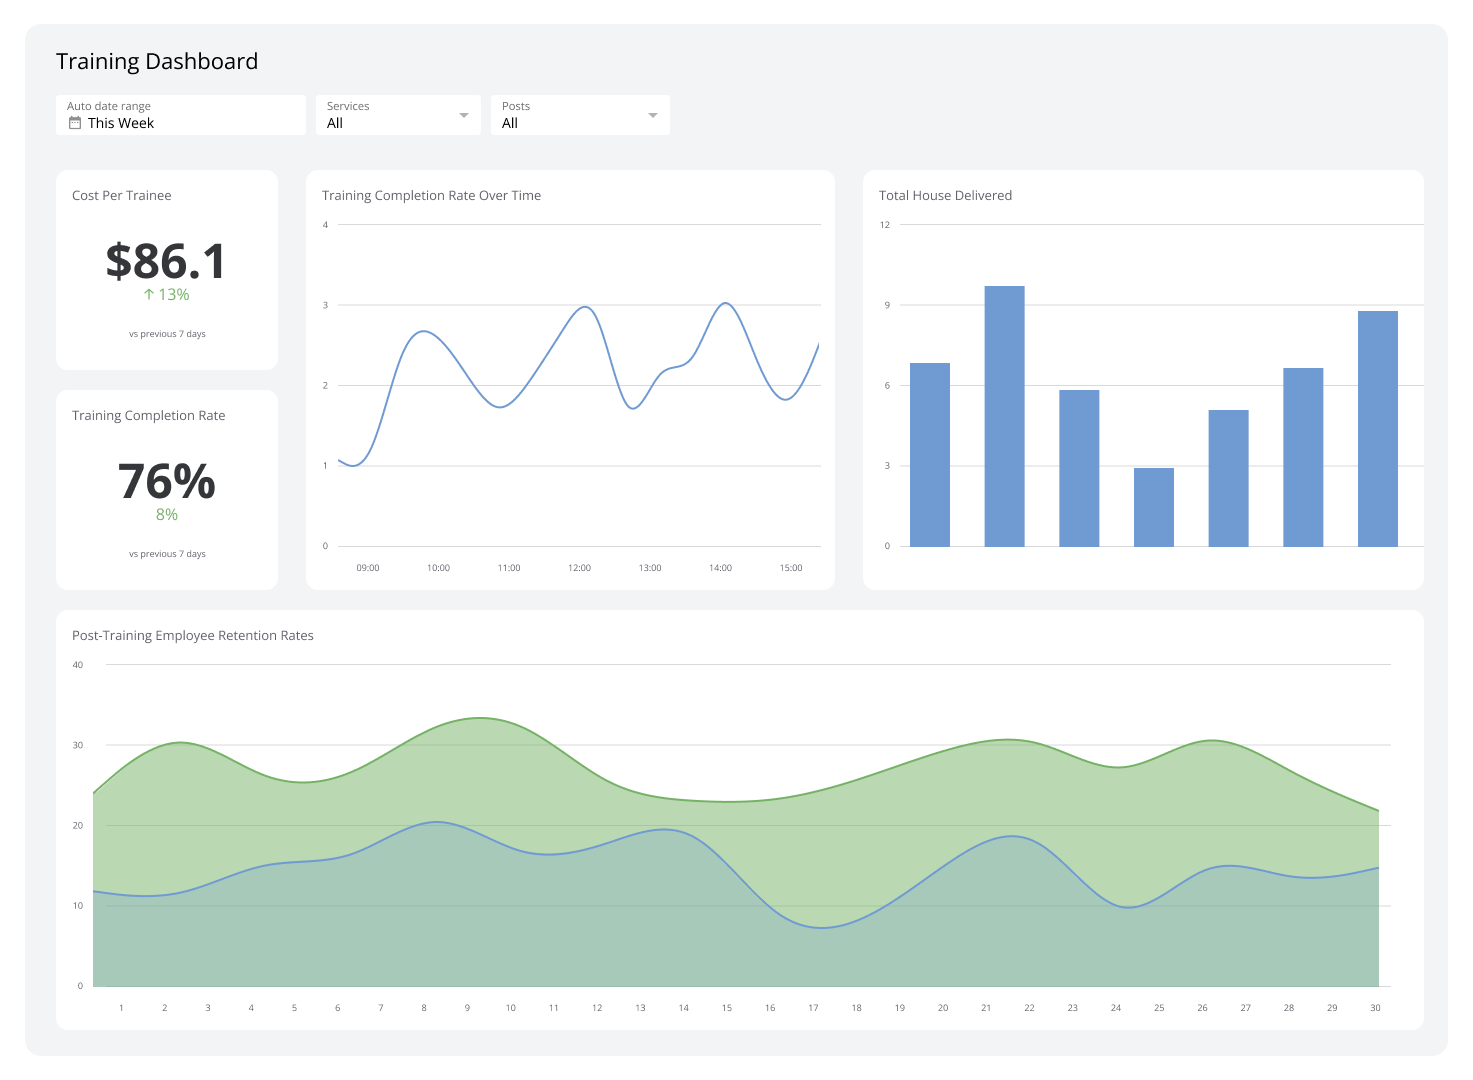
Onboarding Dashboard
An onboarding dashboard shows how new hires are doing in their first few months with your company. It tracks how fast they finish training and how happy they are. This helps you spot problems early, like if someone is struggling to learn their job. This way, you can refine your onboarding work to better help people up to speed.
Who’s it for | HR managers, recruitment coordinators, training coordinators, department heads, team leaders, employee engagement specialists, reporting analysts, onboarding specialists, senior management |
How often it's needed | Real-time, daily, weekly, monthly |
Covered KPIs | Onboarding completion rate, time-to-productivity, training completion rates, new hire retention rate, onboarding satisfaction score, new hire engagement level, time-to-full-compliance, onboarding program effectiveness, feedback from new hires, mentor participation rate, time spent on orientation, document submission rates, onboarding cost per hire, new hire support requests, technical resource allocation time, new hire performance metrics, probation period completion rate, onboarding feedback survey scores, early attrition rate, job readiness of new hires, adherence to onboarding schedule, new hire socialization rate, new hire survey participation, training module completion time, new hire goal achievement rate |
Cost-Per-Hire Dashboard
Cost-per-hire dashboards give you a bird’s eye view of the financial aspects of your recruitment process. Often, they display advertising costs, agency fees, interview travel expenses, referral bonuses, and onboarding costs to break down overall expenses by different hiring stages and sources.
Who’s it for | Recruiters, department heads, hiring managers, business analysts, HR managers, talent acquisition teams, team leaders, recruitment coordinators, reporting analysts |
How often it's needed | Real-time, daily, weekly, monthly |
Covered KPIs | Total recruitment cost, cost per applicant, cost per interview, cost per offer, internal recruitment costs, external recruitment costs, advertising costs, agency fees, onboarding costs, training costs, referral bonus expenses, job posting expenses, cost reduction achieved, budget vs. actual spend, recruitment ROI, time-to-fill correlation with cost, sourcing channel cost-effectiveness, internal vs. external sourcing costs, candidate assessment costs, technology and platform subscription costs, cost per hire by department, cost per hire by role, cost per hire over time, overall cost-efficiency index |
Candidate Diversity Dashboard
A candidate diversity dashboard supplies a clear view of the diversity metrics, such as race, gender, age, and academic background, in your recruitment process. Leveraging the data from a candidate diversity dashboard to identify and address diversity gaps in their recruitment process. This, in turn, contributes to a more diverse workforce that can enhance organizational performance and foster a richer, more lively corporate culture.
Who’s it for | HR managers, recruiters, hiring managers, talent acquisition teams, department heads, business analysts, team leaders, reporting analysts, recruitment coordinators |
How often it's needed | Real-time, daily, weekly, monthly, yearly |
Covered KPIs | Representation of gender, ethnicity, age, disability status, and veteran status among candidates, diversity hiring rate, diversity sourcing channel effectiveness, diversity at different recruitment stages, bias detection in recruitment process, diversity benchmark comparisons, diversity hire ratio by department, diversity hire ratio by role, time-to-hire diversity impact, training program participation rates on diversity, diverse candidate feedback, impact of diversity initiatives on recruitment, diversity campaign effectiveness, applicant drop-off rate by demographic |
Employee Referral Dashboard
An employee referral dashboard shows how well your company’s employees are at bringing in new talent through recommendations. It displays metrics and KPIs that measure the number of referrals made, the number of referrals hired, and who is the most active in referring candidates.
With this dashboard, you can see the real impact of your referral program, showing you if it's actually saving you money on recruitment costs and bringing in high-quality candidates. It can also reveal which employees are most adept at referring candidates who get hired to give you a look at where your company culture might be strongest.
Who’s it for | Business analysts, talent acquisition teams, HR managers, recruiters, department heads, reporting analysts, recruitment coordinators, hiring managers, team leaders |
How often it's needed | Real-time, daily, weekly, monthly |
Covered KPIs | Referral hire rate, time-to-fill for referred candidates, retention rate of referred hires, success rate of referred candidates, employee participation in referral program, cost per referral hire, referral incentive effectiveness, quality of hire from referrals, referral source analysis, referral program satisfaction, geographic referral trends, referred candidates' performance, referral-to-hire conversion rate, diversity of referred candidates, employee feedback on referral process, new hire retention from referrals, impact of referral campaigns, referral bonus payout rates, referred candidates' onboarding experience, referral effectiveness by department, overall referral program impact |
Gender Balance Dashboard
Gender balance dashboards measure your company’s gender ratio and display the percentage of male and female employees in various departments, leadership levels, and job roles. This allows you to spot areas where one gender may be overrepresented, letting you build a better workspace and culture wherein every gender is represented equally.
Who’s it for | Talent acquisition teams, department heads, HR managers, recruiters, reporting analysts, recruitment coordinators, hiring managers, business analysts, team leaders |
How often it's needed | Real-time, daily, weekly, monthly |
Covered KPIs | Applicant gender ratio, gender ratio at each stage of recruitment, offer acceptance rate by gender, time-to-hire by gender, retention rate of hires by gender, gender diversity in sourced candidates, success rate of gender-focused recruitment campaigns, gender pay gap analysis, percentage of leadership roles held by each gender, gender ratio by department, gender ratio in referral hires, feedback on gender-focused initiatives, employee satisfaction by gender, promotion rate by gender, turnover rate by gender, training and development participation by gender, diversity and inclusion program effectiveness, overall gender balance index |
Hiring Velocity Dashboard
A hiring velocity dashboard breaks down how quickly your recruiters can bring in new employees. Some metrics you can expect to see on this dashboard include time-to-hire, the number of open positions filled per month, and the time candidates spend at each stage of the hiring process.
This dashboard helps you uncover issues in your recruitment pipeline, such as lengthy interview processes or sluggish decision-making, which might be causing you to lose candidates to competitors. It can also reveal seasonal trends in hiring speed, allowing you to modify your recruitment efforts accordingly to secure top talent during peak hiring seasons.
Who’s it for | Recruitment coordinators, HR managers, business analysts, team leaders, reporting analysts, department heads, recruiters, talent acquisition teams, hiring managers |
How often it's needed | Real-time, daily, weekly, monthly |
Covered KPIs | Time-to-hire, time-to-fill, average screening time, average interview time, offer acceptance rate, candidate pipeline velocity, applicant processing time, recruitment funnel metrics, source of hire efficiency, candidate drop-off rates, interview-to-offer ratio, application-to-interview ratio, hire impact on team performance, recruitment campaign efficiency, candidate feedback scores, recruiter efficiency metrics, job vacancy duration, onboarding time by department, job offer issuance rate, candidate engagement during hiring, cost per hire, hiring process compliance, candidate experience ratings, impact of recruitment technology, recruiter workload balance |
Salary Comparison Dashboard
A salary comparison dashboard measures how your company’s pay stacks against other businesses. It lets you make smart decisions about salaries to keep workers and save money.
For example, the dashboard can show you where you might be underpaying some workers. It can also reveal if you need to spend less on certain roles.
This information helps you adjust pay to be fair and competitive, which can make your employees happier and more likely to stay in your company.
Who’s it for | Finance teams, department heads, HR managers, reporting analysts, senior management, team leaders, hiring managers, recruitment coordinators, business analysts |
How often it's needed | Real-time, daily, weekly, monthly, yearly |
Covered KPIs | Average salary by role, salary range by position, salary vs. industry average, geographical salary comparison, gender pay gap analysis, pay equity metrics, salary distribution by department, compensation package effectiveness, bonus and incentive structure, cost of living adjustments, salary progression over time, employee satisfaction with compensation, retention rates based on salary competitiveness, impact of salary changes on recruitment, job offer acceptance rate, market salary trends, internal salary alignment, payroll budget utilization, cost per hire, salary negotiation success rate, salary-related turnover rate |
Job Offer Dashboard
Job offer dashboards show how many offers have been accepted, rejected, or are still awaiting a response. With it, you can spot application trends, such as if certain positions are more challenging or if your salary offers are too low. Moreover, it can also uncover how long it takes candidates to decide on an offer.
Who’s it for | HR managers, recruitment coordinators, business analysts, senior management, finance teams, department heads, hiring managers, team leaders, reporting analysts |
How often it's needed | Real-time, daily, weekly, monthly |
Covered KPIs | Job offer acceptance rate, job offer decline rate, time to fill, time to hire, cost per hire, offer acceptance by role, offer decline reasons, offer approval process time, candidate feedback on offer process, recruitment funnel metrics, candidate experience score, onboarding success rate, impact of salary on offer acceptance, impact of benefits on offer acceptance, offer negotiation success rates, diversity of hires, candidate retention post-offer, acceptance rate by recruitment channel, conversion rate from interview to offer, speed of offer generation, candidate satisfaction with offer process, competitive offer analysis, efficiency of offer approval workflows |
Interview Scheduling Dashboard
An interview scheduling dashboard helps you manage all your scheduled job interviews in one place. It shows who’s interviewing when, which rooms are available, and which interviewers are free, making it easy to spot scheduling conflicts and quickly find periods that work for everyone.
The data in this dashboard can be used to track the time it takes to schedule interviews for different positions, revealing bottlenecks in your hiring process, such as slow-responding departments or positions requiring multiple rounds of interviews.
Who’s it for | Technical interviewers, department heads, administrative assistants, senior management, recruitment coordinators, team leaders, HR managers, hiring managers, reporting analysts, business analysts |
How often it's needed | Real-time, daily, weekly, monthly |
Covered KPIs | Number of scheduled interviews, interview cancellation rate, interview rescheduling rate, time from application to interview, interviewer availability metrics, candidate no-show rate, time spent on scheduling, candidate satisfaction with the scheduling process, interviewer feedback on scheduling efficiency, use of scheduling automation tools, interview panel diversity, impact of scheduling on candidate experience, reminders' effectiveness rate, alignment with candidate preferences, interview slot utilization rates, scheduling process completion time, internal communication efficiency, interview-to-offer conversion rate, response time to scheduling requests, scheduling conflict resolution rate, candidate feedback on interview process |
Recruitment data acquisition simplified through dashboards
Recruitment dashboards simplify the data acquisition and analysis process for internal company recruiters and recruitment agencies. They display critical information regarding all facets of the hiring process, from a candidate’s initial application to onboarding. With their help, you can formulate data-driven decisions, spot trends, and better understand your hiring process.
Klpifolio provides customizable recruitment dashboards with real-time information. Try it out today!
Related Dashboards
View all dashboards