Diversity Dashboard
Diversity Dashboard
Focusing on diversity is crucial for a workplace that’s more productive and efficient. In fact, companies that are more diverse and inclusive have a 35% chance of being more profitable than their competitors.
A diversity dashboard provides a comprehensive overview of representation across different demographics, pay equity, and employee turnover rates. This tool shows you the areas you can improve to foster a more inclusive and equitable work environment. Let’s discover the benefits of using a diversity dashboard and the process of creating one for your organization.
What is a diversity dashboard?
A diversity dashboard is a tool that provides insights into the demographic makeup of your workforce. Tracking this data set helps you identify patterns, improve recruitment strategies, reduce unconscious hiring bias, and promote accountability.
Identify patterns in workforce demographics
Using a diversity dashboard lets you see if certain groups, like women or people of color, are underrepresented in specific roles or departments. Recognizing these patterns allows you to address imbalances and create a more inclusive workplace.
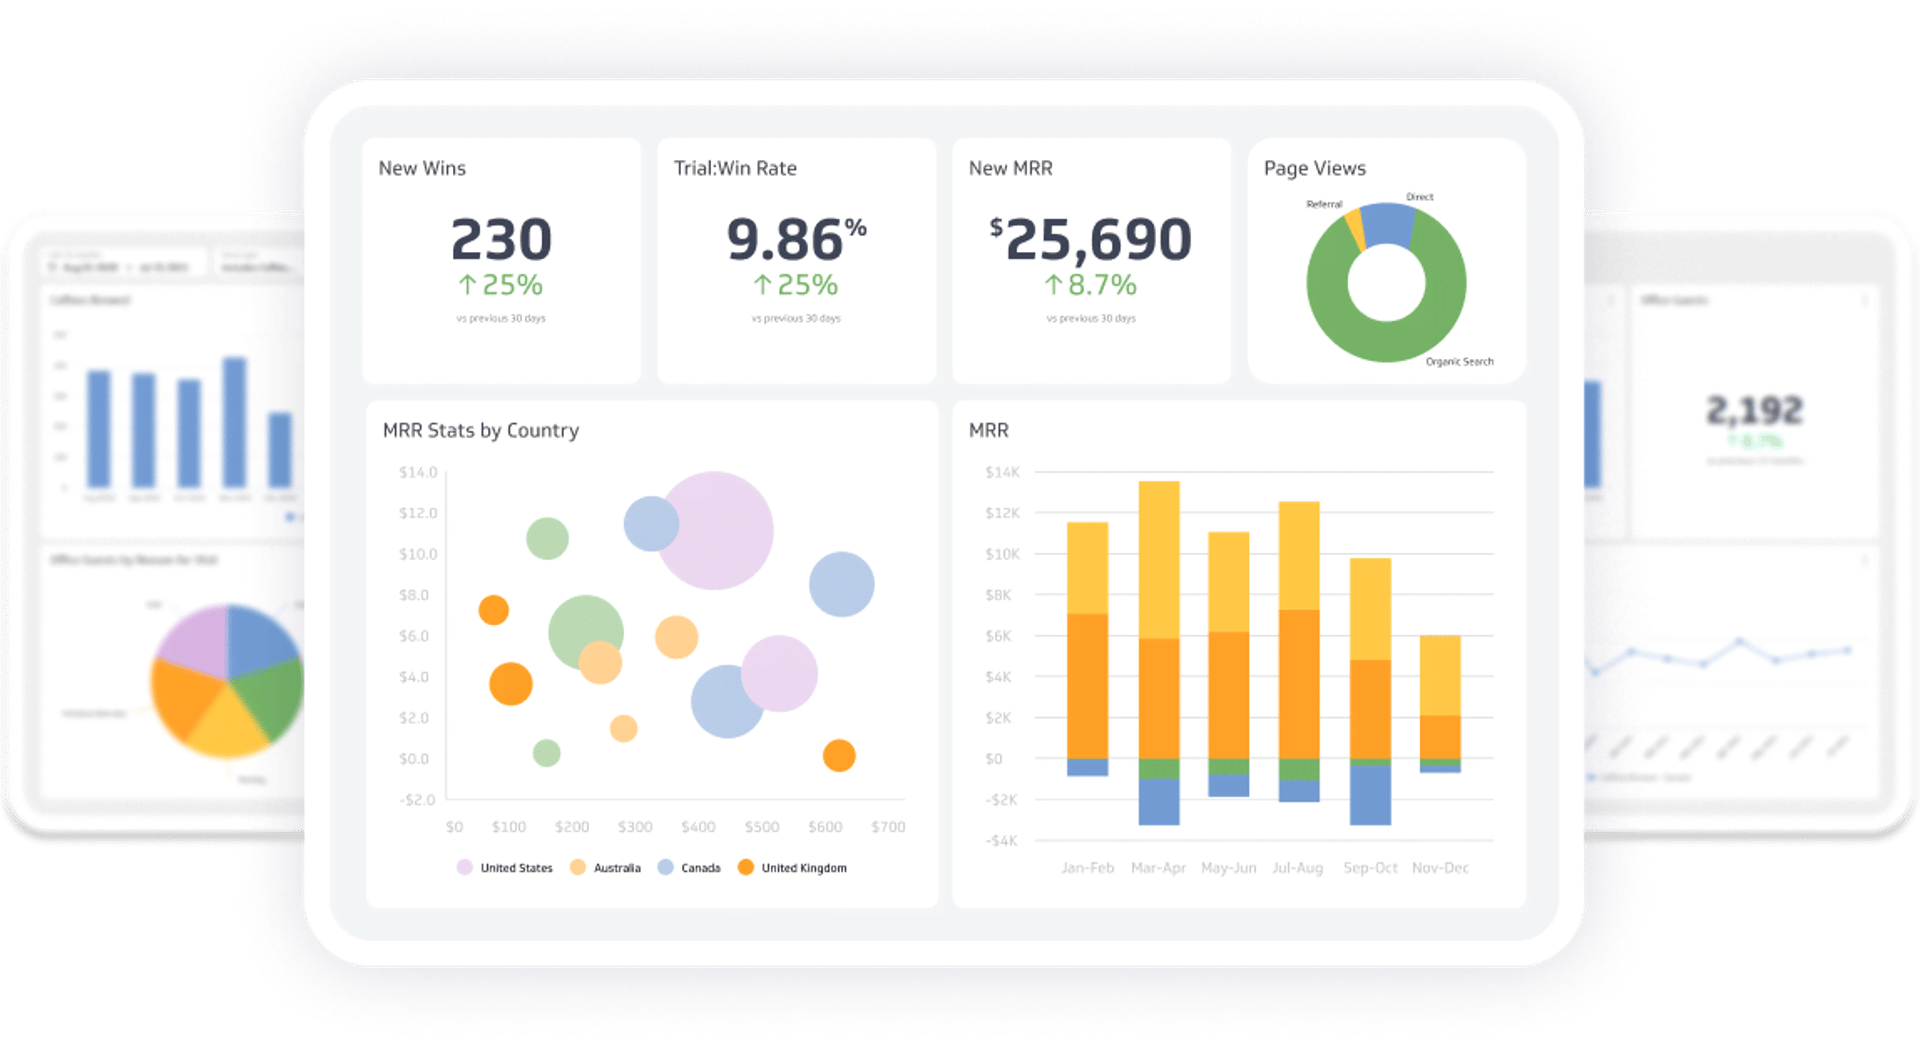
Easy data visualization through charts, graphs, and tables allows you to spot patterns and trends at a glance. With PowerMetrics, you can also drill down into specific data points to get deeper insights.
Improve recruitment strategies
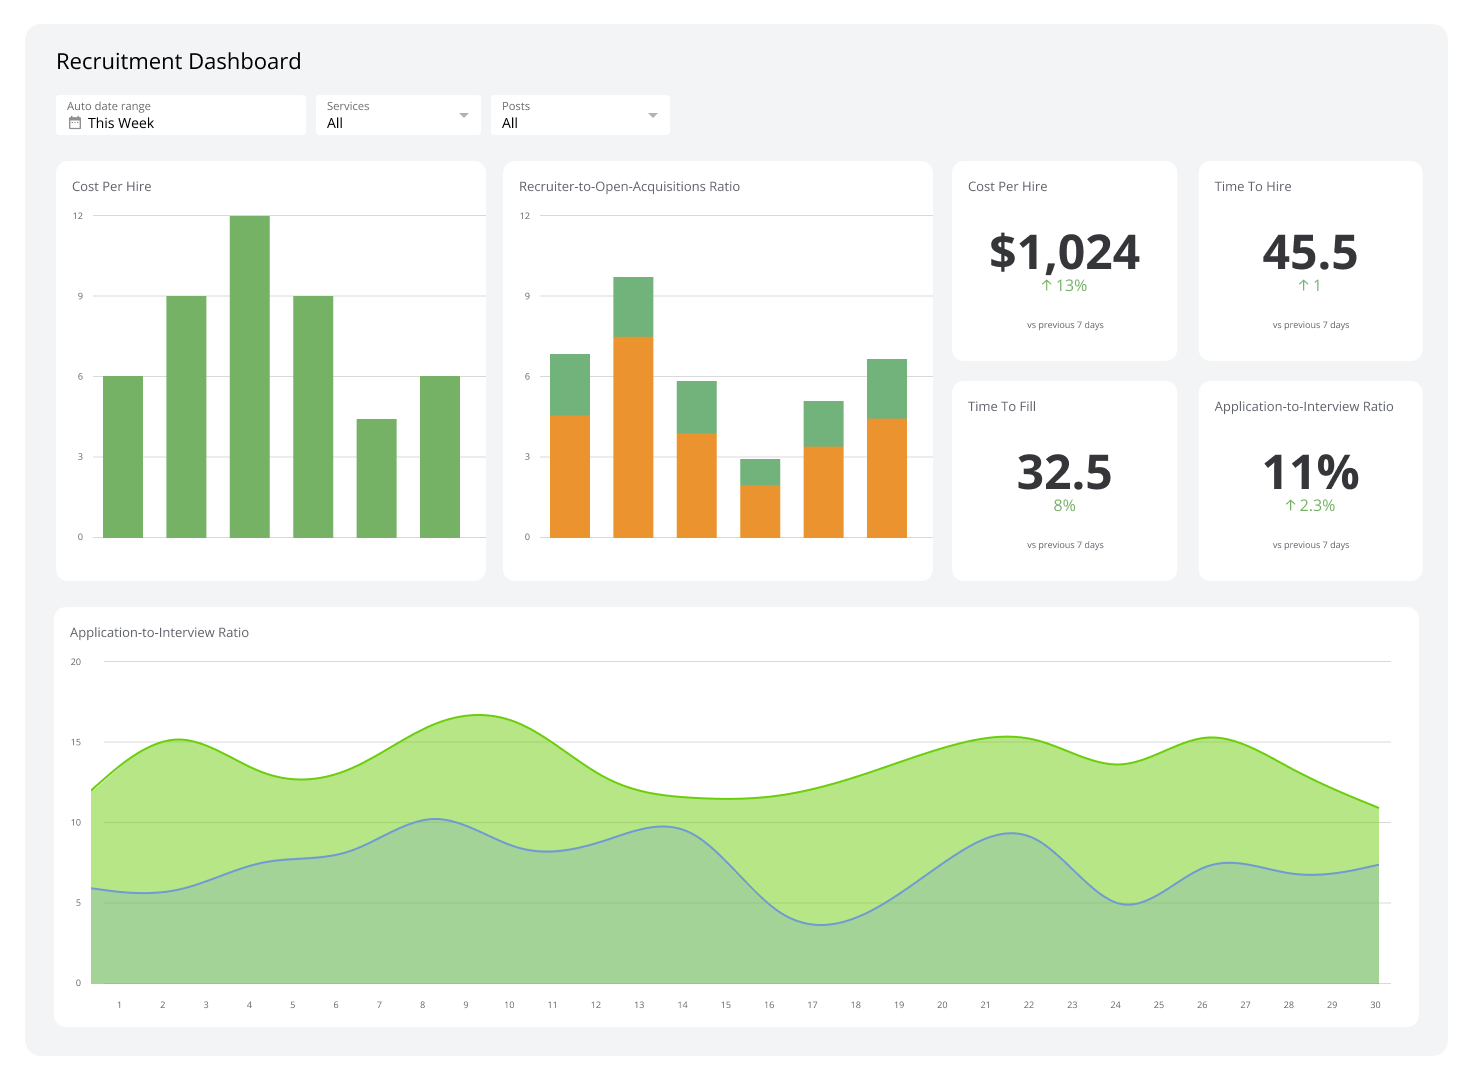
If your HR dashboard shows that most hires come from similar backgrounds, you can change your approach to reach a broader audience. This might involve partnering with different organizations, attending diverse job fairs, or adjusting your job postings to appeal to a wider range of candidates.
Reduce unconscious hiring bias
A diversity dashboard helps bring unconscious biases to light. For example, if the dashboard reveals that certain demographics are consistently overlooked during the hiring process, you can take steps to implement diversity training for hiring managers (tip: use training dashboards to track progress) or revise interview processes to be more inclusive.
Promote accountability
When everyone in the organization can see the data, it creates a sense of responsibility to improve. Managers and leaders are more likely to take action to promote diversity and inclusion when they know where they stand. This transparency helps guarantee that diversity initiatives are taken seriously and that progress is made toward creating a more inclusive workplace.
Related Dashboards
View all dashboards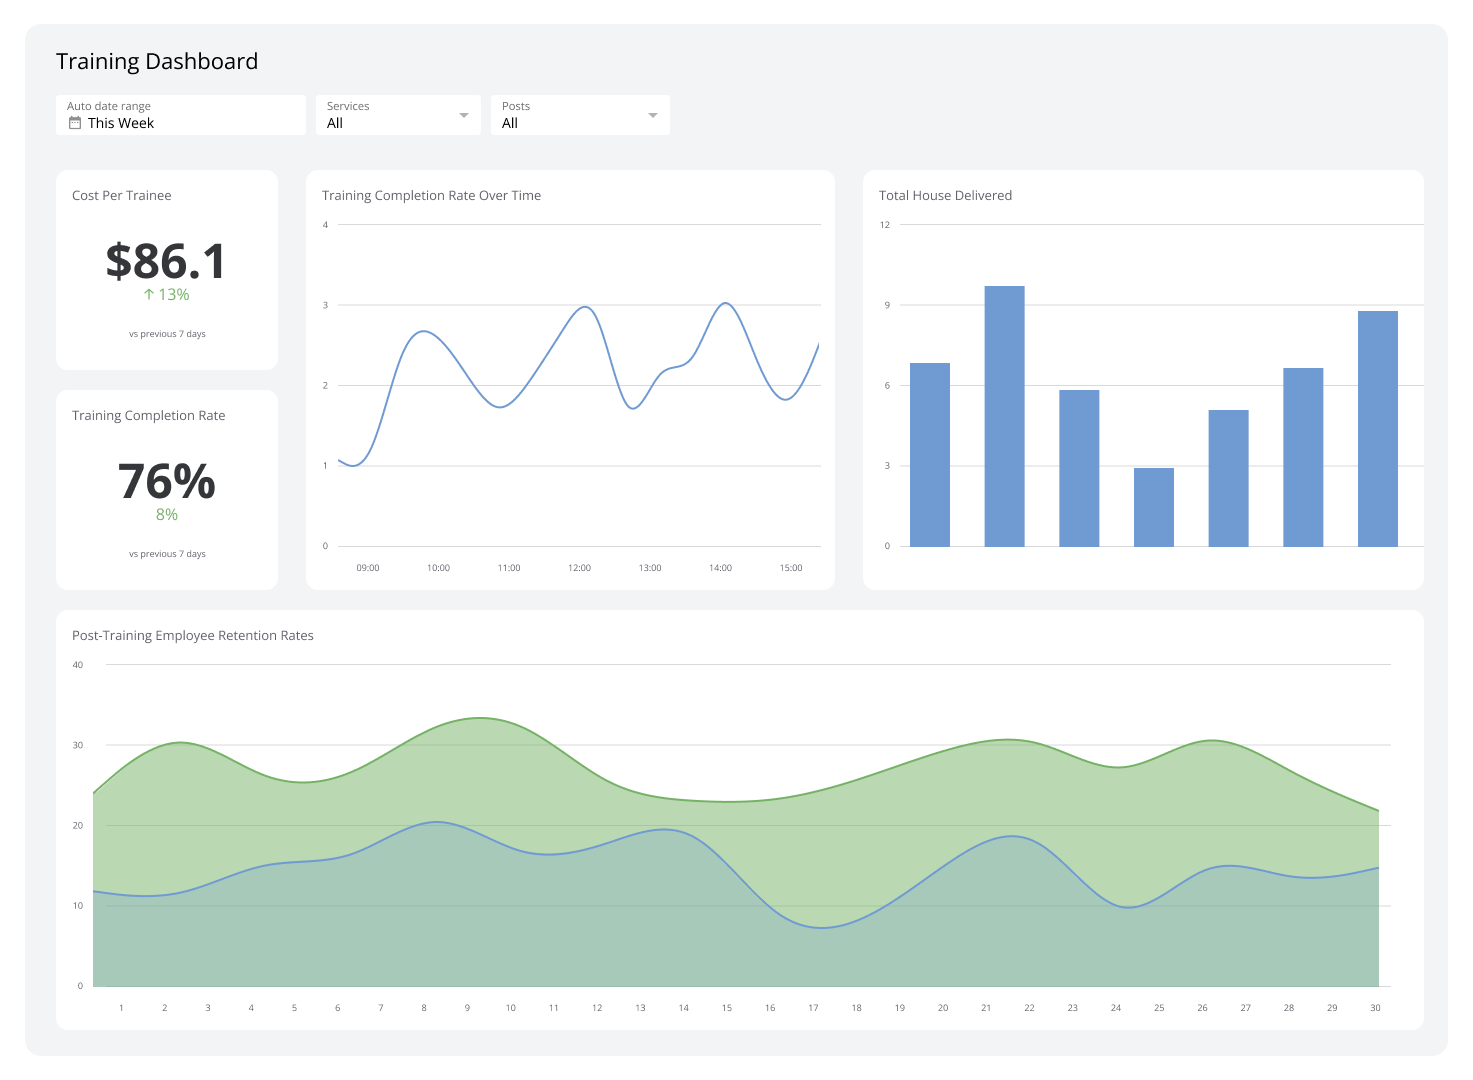
3 key metrics to track in diversity dashboards
Monitoring key metrics like ethnic diversity ratio, gender ratio, and the number of people from minority groups provides insights into your company’s workforce. Let’s take a closer look at each metric:
Ethnic diversity ratio
Gender ratio
People from underrepresented minority groups in the team
Ethnic diversity ratio
A diverse team brings different viewpoints that can lead to more innovative ideas and better problem-solving. By monitoring the ethnic diversity ratio, you can see if your organization is successfully attracting and retaining employees from various ethnic backgrounds.
Gender ratio
This metric helps you see whether your company is promoting gender equality and fostering a more inclusive workplace culture. Improve your gender ratio by keeping your job postings gender-neutral. You can also implement policies that support work-life balance, such as flexible working hours and parental leave, to make your workplace more attractive to parents, especially mothers.
People from underrepresented minority groups in the team
A higher percentage of team members from underrepresented minority groups indicates a commitment to diversity and inclusion. This can lead to a more dynamic and innovative workplace, as well as higher employee satisfaction and retention.
Best practices for creating a diversity dashboard
As you create your diversity dashboard, it’s important to stay objective and have clear benchmarks to track progress. Here are four best practices
Stay objective
It can be easy to become defensive or in denial when faced with the realities of your workforce. Nonetheless, you must take a step back and see the overall picture.
Staying objective allows you to see the data for what it is and gain insights as to where your organization is lacking. Moreover, it prevents personal biases from skewing the data to reflect your diversity goals.
Set clear benchmarks for progress
Speaking of goals, you must set clear benchmarks or specific targets so you can track progress. Doing so helps keep everyone aligned and focused on making meaningful progress. It also helps motivate employees and management by showing tangible goals and achievements.
Keep the dashboard accessible
An accessible dashboard makes sure that everyone is aware of the organization’s efforts towards diversity and inclusion. By allowing employees to gain insights from the dashboard, they can actively participate in creating a more inclusive workplace
Involve key stakeholders
Commitment to diversity should start with top management and cascade down to the frontlines. As you create your diversity dashboard, keep them involved by getting their insights and feedback. This collaborative approach fosters a culture where everyone feels valued and included in driving meaningful progress.
Building a culture of inclusion with Klipfolio
Creating a diversity dashboard shows you gaps in your workforce that you may not have noticed before. By using tools like Klipfolio PowerMetrics, you can empower your workforce to create a professional environment where skills and talent are prioritized rather than demographic factors.
Sign up with Klipfolio for free today and start building a culture of inclusion in your organization.
