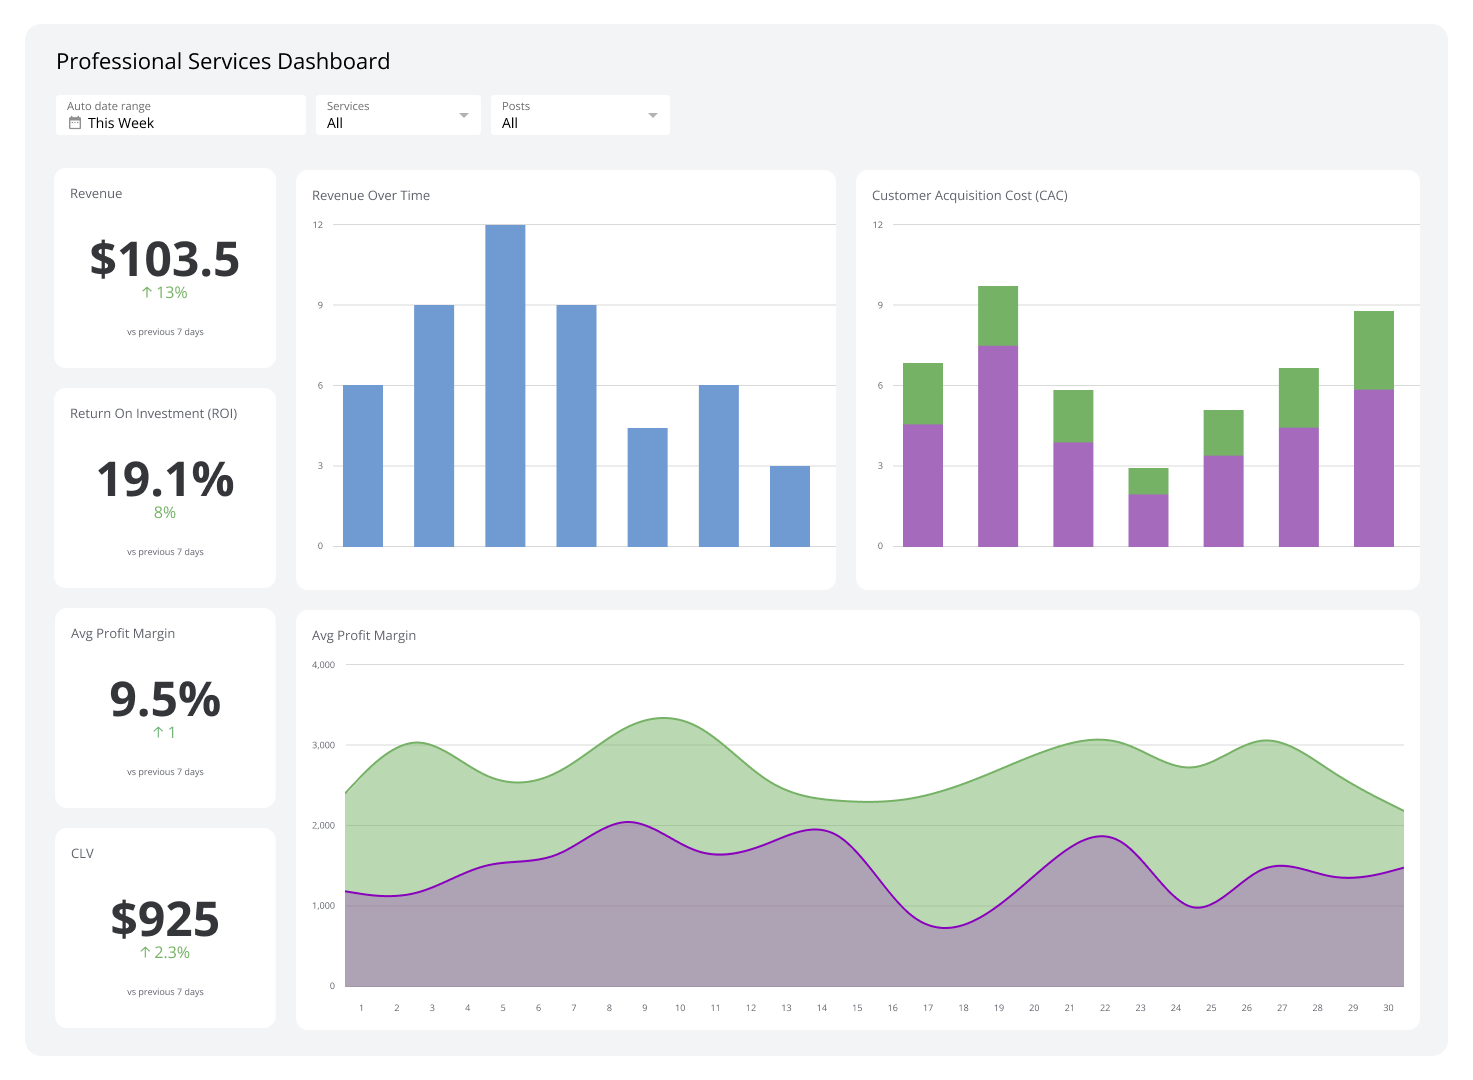
Professional Services Dashboard
A professional services dashboard displays metrics and KPIs relevant to service-based businesses, such as consultancies and agencies.
What is a Professional Services Dashboard?
A professional services dashboard provides real-time insights into key metrics and performance indicators for service-based businesses. Some data they display include goal progress, resource allocation, billable hours, client satisfaction, and financial performance.
In Klips, you connect apps, spreadsheets, databases, and APIs, then centralize that data into clear charts, tables, and visuals that anyone can read. Set refresh schedules or use live updates so every stakeholder works with current numbers.
Examples of Professional Services Dashboards
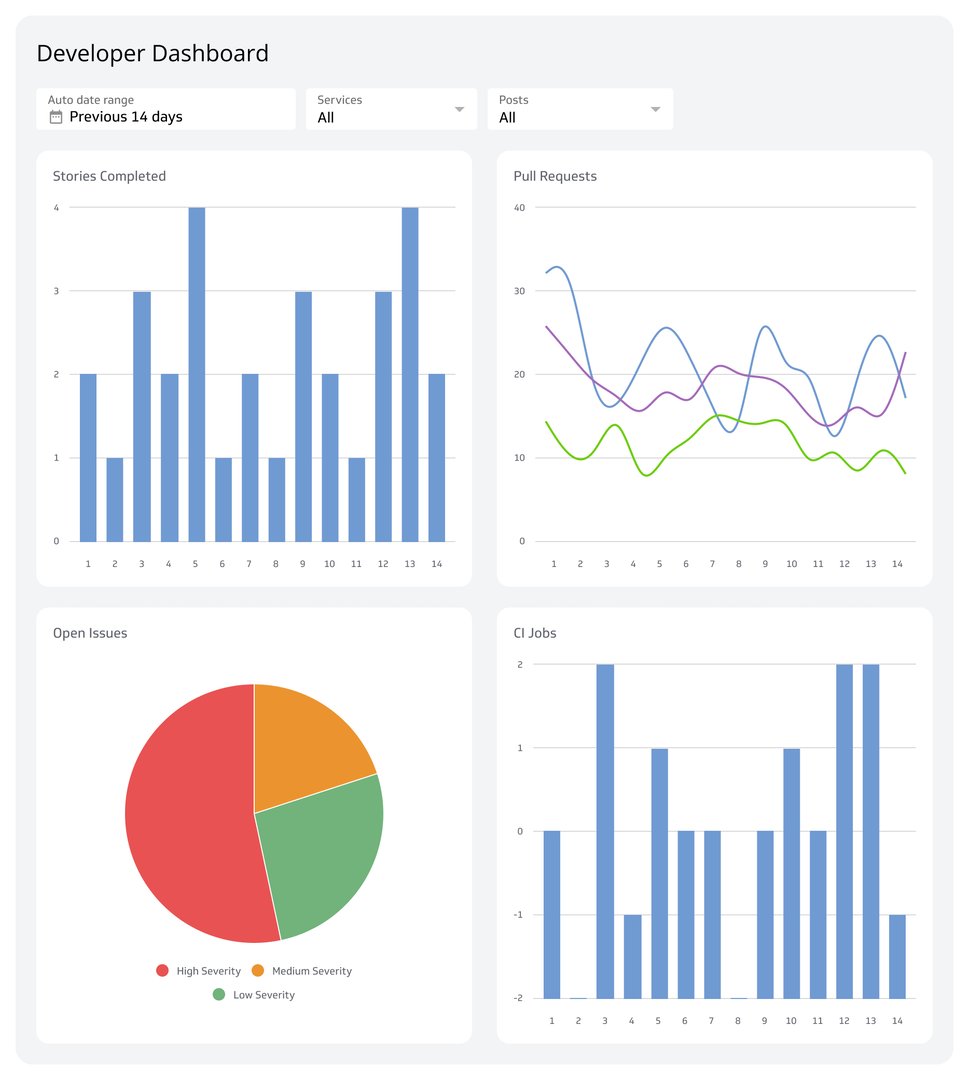
Business Performance Dashboard
Business performance dashboards let you gauge the overall health of your professional service business. They give you a high-level overview that details performance, efficiency, and progress toward goals, pinpointing where you should concentrate manpower, resources, and marketing.
Well-designed business performance dashboards present real-time information that allows you to spot trends and identify problems before they escalate.
Beyond that, these dashboards can be customized to reflect specific KPIs, guaranteeing that their data is relevant to your professional service business's objectives.
Who’s it for | Business owners, financial analysts, investors, supply chain managers, quality assurance managers |
How often it's needed | Real-time, daily, weekly, monthly, quarterly, yearly |
Covered KPIs | Revenue growth rate, profit margin, return on investment (ROI), customer acquisition cost (CAC), customer lifetime value (CLV), employee productivity, operational efficiency, market share, customer satisfaction score (CSAT), net promoter score (NPS), inventory turnover ratio, accounts receivable turnover, debt-to-equity ratio, cash flow, gross profit margin, net profit margin, operating expense ratio, customer retention rate, sales growth, employee turnover rate, time to market for new products/services, capacity utilization rate, on-time delivery rate, customer complaints, average resolution time, sales pipeline value, lead conversion rate, website traffic and conversion rate, brand awareness metrics, compliance metrics, employee engagement score, diversity and inclusion metrics, project completion rate and budget adherence, return on assets (ROA), return on equity (ROE), earnings before interest, taxes, depreciation, and amortization (EBITDA), economic value added (EVA), working capital ratio, quick ratio, inventory days, accounts payable days, cost of goods sold (COGS), average revenue per user (ARPU), customer churn rate, employee net promoter score (eNPS), time to hire, cost per hire |
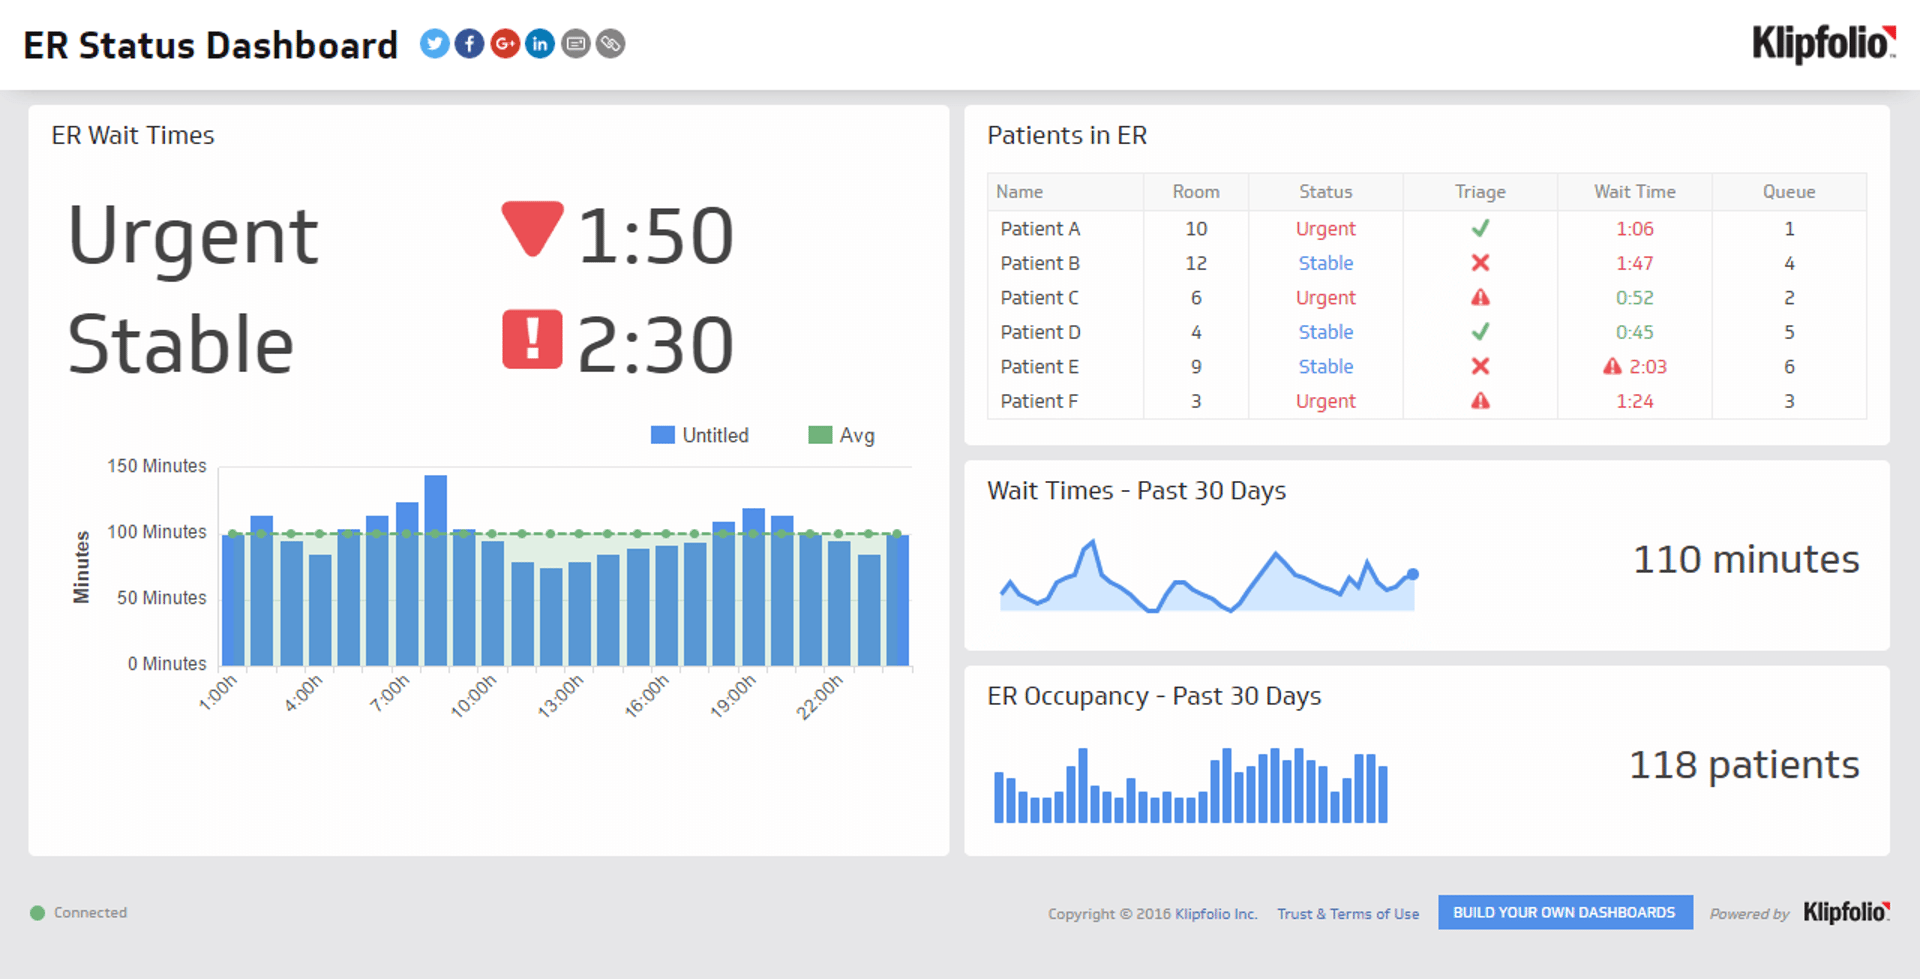
Financial Performance Dashboard
Financial performance dashboards help professional services get a clearer picture of their fiscal health. They’re instrumental in assessing data related to revenue growth, profit margins, cash flow, and return on investment, which you can use to spot potential issues and drive growth.
For instance, a financial performance dashboard might show that while revenue is growing, profit margins are decreasing. This could prompt an investigation into rising costs or wrong pricing strategies, leading to changes such as cost-cutting measures or adjusting product prices to maintain profitability.
Who’s it for | Financial analysts, accountants, treasury managers, financial controllers, business unit managers, budget analysts, risk managers, financial planners, auditors |
How often it's needed | Real-time, daily, weekly, monthly, quarterly, yearly |
Covered KPIs | Revenue growth rate, gross profit margin, operating profit margin, net profit margin, EBITDA margin, ROE, ROA, earnings per share (EPS), price-to-earnings (P/E) ratio, debt-to-equity ratio, current ratio, quick ratio, inventory turnover, accounts receivable turnover, accounts payable turnover, cash conversion cycle, free cash flow, working capital ratio, capital expenditure as a percentage of revenue, dividend payout ratio, interest coverage ratio, asset turnover ratio, operating expense ratio, revenue per employee, profit per employee, days sales outstanding (DSO), days inventory outstanding (DIO), days payables outstanding (DPO), economic value added (EVA), market share, stock price performance, price-to-book (P/B) ratio, return on invested capital (ROIC), cost of capital, earnings before interest and taxes (EBIT) margin, gross margin trend, operating cash flow, cash flow from operations to net income ratio, fixed asset turnover ratio, total shareholder return (TSR), economic profit, sales growth decomposition, sustainable growth rate, credit rating, weighted average cost of capital (WACC), enterprise value to EBITDA ratio, price-to-sales ratio, dividend yield, payout ratio trend, operating leverage, financial leverage, break-even point analysis, contribution margin ratio, liquidity ratios, solvency ratios, profitability ratios, efficiency ratios |
Social Media Dashboard
A social media dashboard allows you to monitor, analyze, and supervise your social media presence more efficiently. It lets you consolidate and view social media performance across every platform, such as Facebook, X, Instagram, and LinkedIn.
This dashboard typically displays metrics like sentiment analysis, engagement rates, follower growth, and post reach. More importantly, it lets you pinpoint all your successful content strategies and calculate the return on investment for your social media efforts.
Who’s it for | Social media managers, digital marketers, content creators, community managers, brand managers, PR specialists, business owners, marketing directors, customer service teams, influencer managers, advertising specialists |
How often it's needed | Real-time, daily, weekly, monthly |
Covered KPIs | Follower growth rate, engagement rate (likes, comments, shares), reach, impressions, click-through rate (CTR), social media traffic to website, conversion rate from social media, social media ROI, post performance by type (image, video, text), best performing hashtags, audience demographics, sentiment analysis, brand mentions, response time to messages/comments, share of voice, user-generated content metrics, social media ad performance, CPC, cost per thousand impressions (CPM), video views and completion rate, story views and completion rate, social media lead generation, influencer campaign performance, social listening metrics, competitor benchmarking, top performing posts, best times to post, audience growth by platform, social media customer service metrics, social selling index, dark social traffic, social media referral traffic, social media conversion path, social media attribution, social media share of total marketing ROI, social media campaign performance, community engagement metrics, social media-driven revenue |
Time Management Dashboard
A time management dashboard acts as a platform for professional services to observe and analyze time allocation across teams and individual employees. This service dashboard often showcases billable hours, project time allocation, task completion rates, productivity levels, and time spent on different activities.
Professional services can use this dashboard to more easily identify and adjust time-consuming tasks to improve efficiency, productivity, and return on investment for the time spent on these activities.
Who’s it for | Productivity specialists, freelancers, consultants, business owners, resource planners, time management coaches, billing specialists |
How often it's needed | Real-time, daily, weekly, monthly |
Covered KPIs | Billable hours, non-billable hours, utilization rate, time spent per project/client, task completion rate, overtime hours, time tracking compliance, time-to-completion for tasks, time allocation by activity type, productivity rate, revenue per hour, project profitability, estimated vs. actual time spent, deadline adherence, time spent on meetings, breaks and idle time, time spent on administrative tasks, time tracking accuracy, resource capacity, time spent on high-priority vs. low-priority tasks, time distribution across departments, time spent on billable vs. non-billable work, project timeline progress, time spent on rework, multitasking metrics, time spent on training and development, time tracking tool adoption rate, time spent on client communication, time allocation alignment with goals, time spent on different phases of projects, time management ROI, employee time management satisfaction, time saved through process improvements, time spent on strategic vs. operational activities, time tracking trends over periods, time spent on value-adding activities, time management efficiency score |
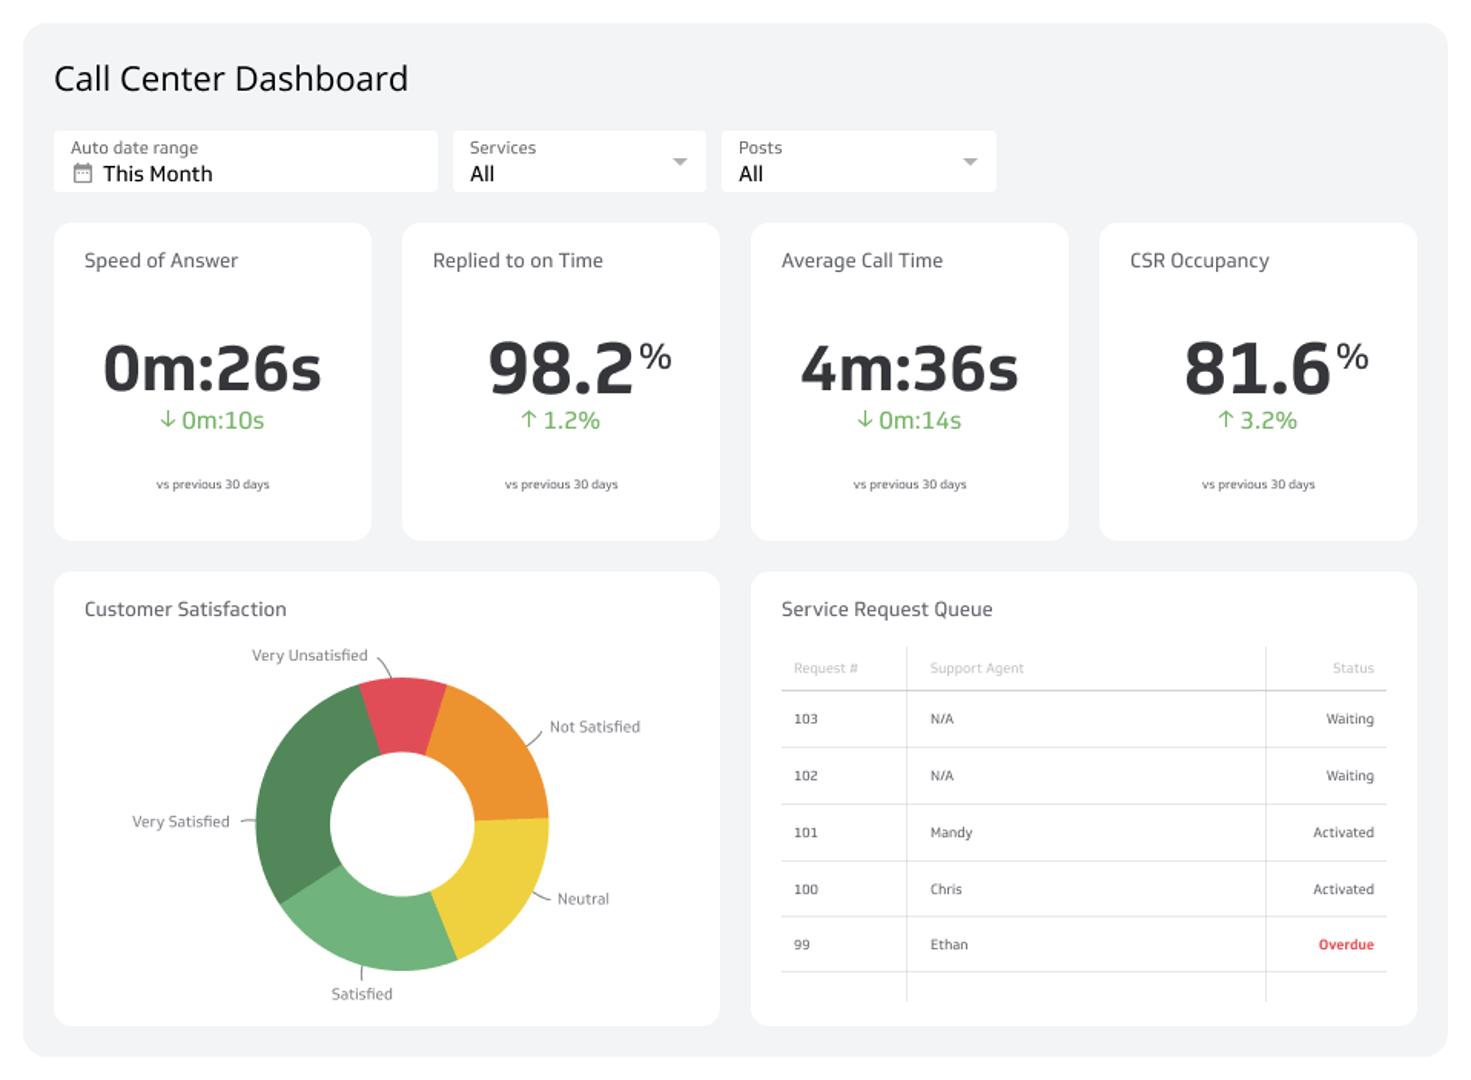
Client Relationship Dashboard
A client relationship dashboard gives professional services a sweeping overview of client health, engagements, and interactions. By aggregating data from emails, meetings, projects, and support tickets, these dashboards can come up with metrics like client satisfaction scores, project statuses, revenue per client, communication frequency, and service level agreement (SLA) adherence.
Regularly monitoring this dashboard helps professional services handle their client relationships more effectively. The data it provides can be capitalized upon to boost client retention or uncover upselling opportunities that would otherwise easily be overlooked.
Who’s it for | Account managers, client success managers, sales representatives, project managers, customer service representatives, relationship managers, consultants, professional service providers, business owners |
How often it's needed | Real-time, daily, weekly, monthly, quarterly |
Covered KPIs | CSAT, NPS, client retention rate, client churn rate, lifetime value (LTV), revenue per client, project completion rate, on-time delivery rate, average response time, number of active projects per client, upsell/cross-sell success rate, client engagement score, meeting frequency, email response time, contract renewal rate, client profitability, average project duration, client feedback scores, number of support tickets raised and resolved, average issue resolution time, client health score, client acquisition cost, time to onboard new clients, client communication frequency, project milestone achievement rate, client portal usage metrics, service level agreement (SLA) compliance rate, client training sessions conducted, number of escalations, client risk assessment score, account growth rate, loyalty program engagement, average client lifespan, client segmentation metrics, number of key stakeholders engaged per client, client knowledge base usage, client survey participation rate, time since last contact, client reactivation rate, client payment history, client sentiment analysis, client advocacy score |
Service/Product Portfolio Dashboard
A service/product portfolio dashboard summarizes the performance of all your offered services. Focusing on live data, this tool presents the figures behind metrics and KPIs like revenue per service/product, customer satisfaction scores, and profitability margins.
This dashboard makes tracking your entire portfolio much more straightforward. It also simplifies the process of identifying your high-performing and underperforming offerings, which, in turn, will make deciding where to assign time and resources for maximum ROI easier.
Who’s it for | Product managers, service managers, business analysts, sales managers, marketing directors, R&D teams, portfolio strategists, business development managers, customer success managers, operations managers, financial analysts, product owners, service delivery managers |
How often it's needed | Real-time, daily, weekly, monthly, quarterly |
Covered KPIs | Revenue per service/product, profit margin by offering, market share, CSAT, NPS, product lifecycle stage, time-to-market for new offerings, CAC, CLV, churn rate, adoption rate, cross-sell/upsell rates, ROI per offering, product/service utilization rate, development costs, maintenance costs, ARPU, product/service growth rate, competitive positioning, pricing effectiveness, inventory turnover (for products), service delivery efficiency, product defect rate, service level agreement (SLA) compliance, customer retention rate, product/service cannibalization rate, time spent on each service/product, resource allocation across portfolio, product/service profitability index, customer feedback and ratings, market penetration rate, product/service diversification index, portfolio balance, portfolio risk assessment, geographic performance of offerings, sales cycle length by offering, customer segmentation by offering, seasonality impact on portfolio performance, regulatory compliance metrics |
Dashboards streamline data acquisition for professional services
A company specializing in professional services can use a professional services dashboard to simplify how metrics and KPIs are gathered and shared. With Klips, you can track resource utilization, project profitability, client satisfaction, and more in real time.
Share results your way: TV mode, public links, embeds, scheduled emails, or PDFs. Start a free Klips trial.
Related Dashboards
View all dashboards