

Make metrics
everybody’s business
Put data analysis, dashboard creation, and embedded visualizations into the hands of your business users with a centralized, curated metric catalog, governed by the data team.


Recognized as a front runner (Software Advice), a high performer (G2 Crowd), and a category leader (GetApp) in Analytics and Business Intelligence.

"PowerMetrics gives non-technical business users exactly what they need, without having to worry about the technology underpinnings. A centralized, managed inventory of metrics is an excellent complement to traditional BI tools, making them more powerful and consistent."

Adam Roderick,
CEO, Datateer
The all-in-one metric platform
Part of the modern data stack, PowerMetrics sits between the data source and the consumer. Data professionals use our platform to provide defined, governed metrics to business users across various consumption end points. Our powerful, yet approachable, no-code design makes it easy for consumers to explore and analyze data for inspired, informed decisions.


See how it works.
Define metrics once and analyze anywhere. Learn how PowerMetrics helps your organization provide consistent, trusted metrics for exploration and discovery.
Define metrics once
Work with your
single source of truth.
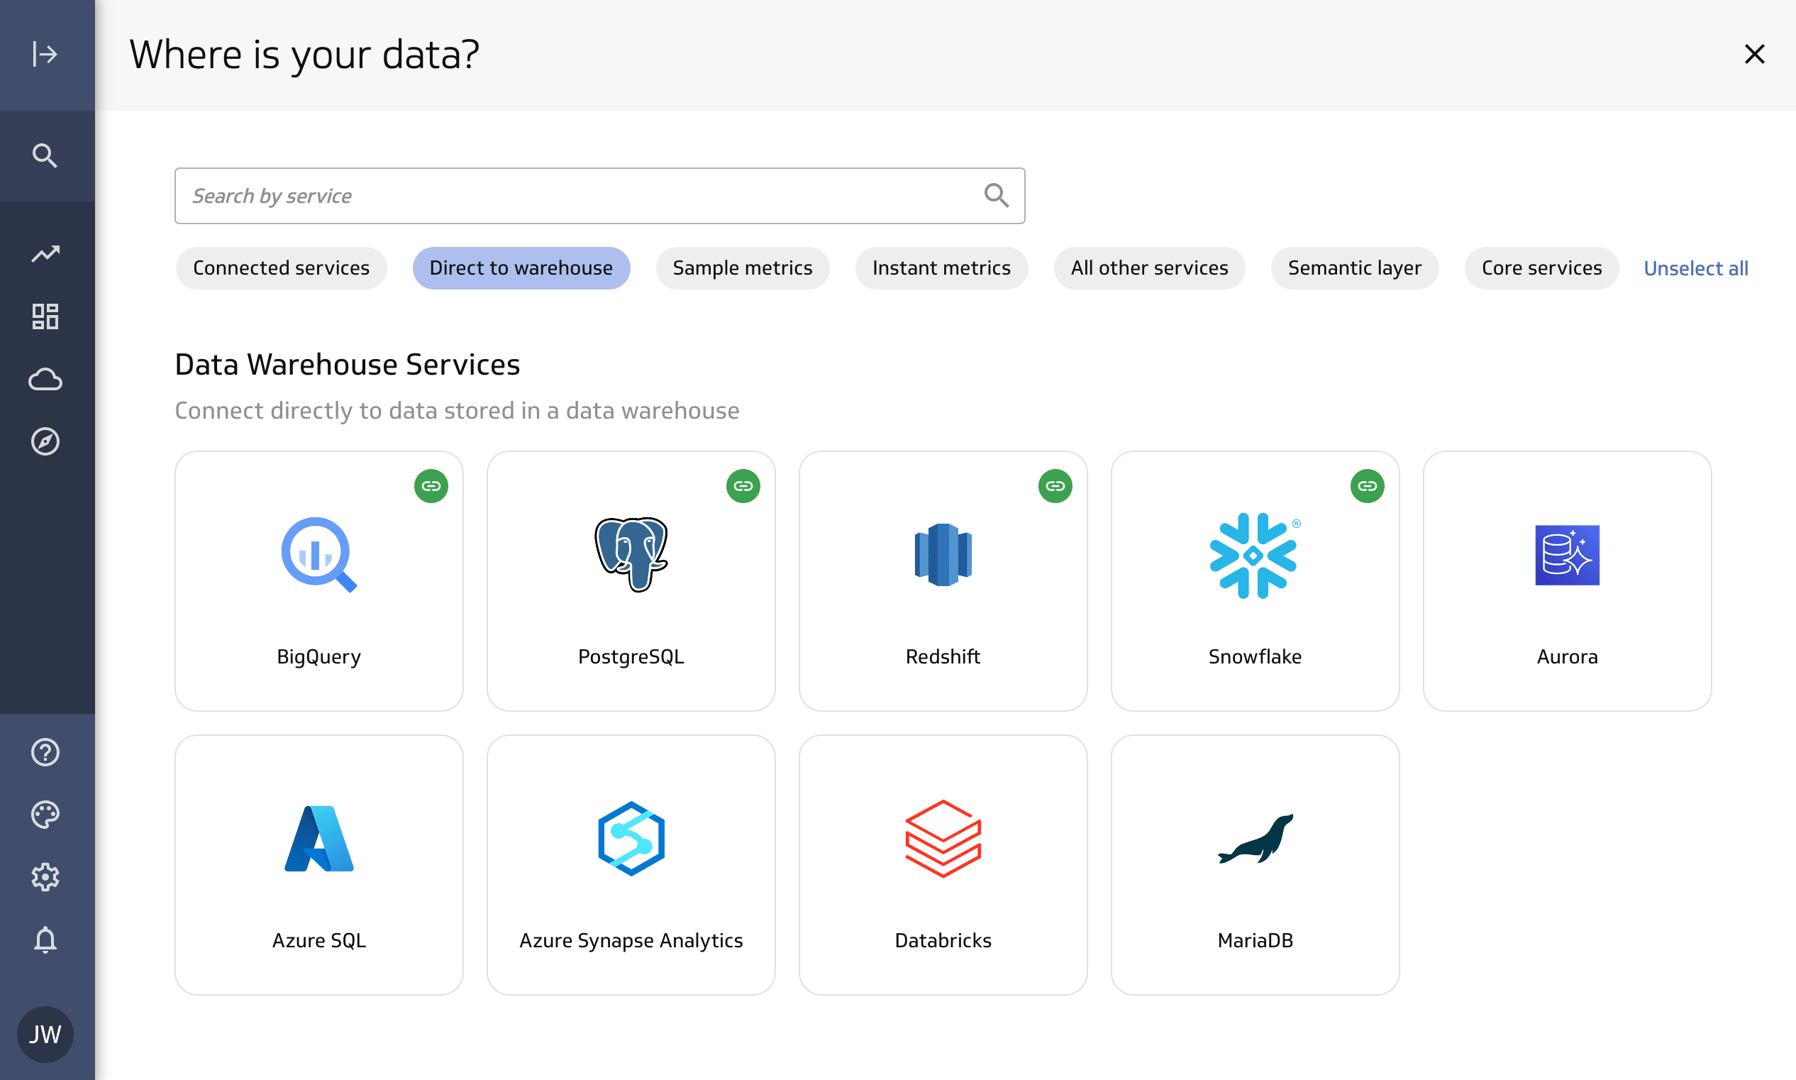
Ensure SSOT data with certified, defined, governed metrics. Your data lives where it should, in your data warehouse, semantic layer, or, if you use data feeds, within PowerMetrics. Our hybrid design means you can choose one or more integration method and modify your choices as your data stack evolves.
Data Warehouses
Semantic Layers
Other Services
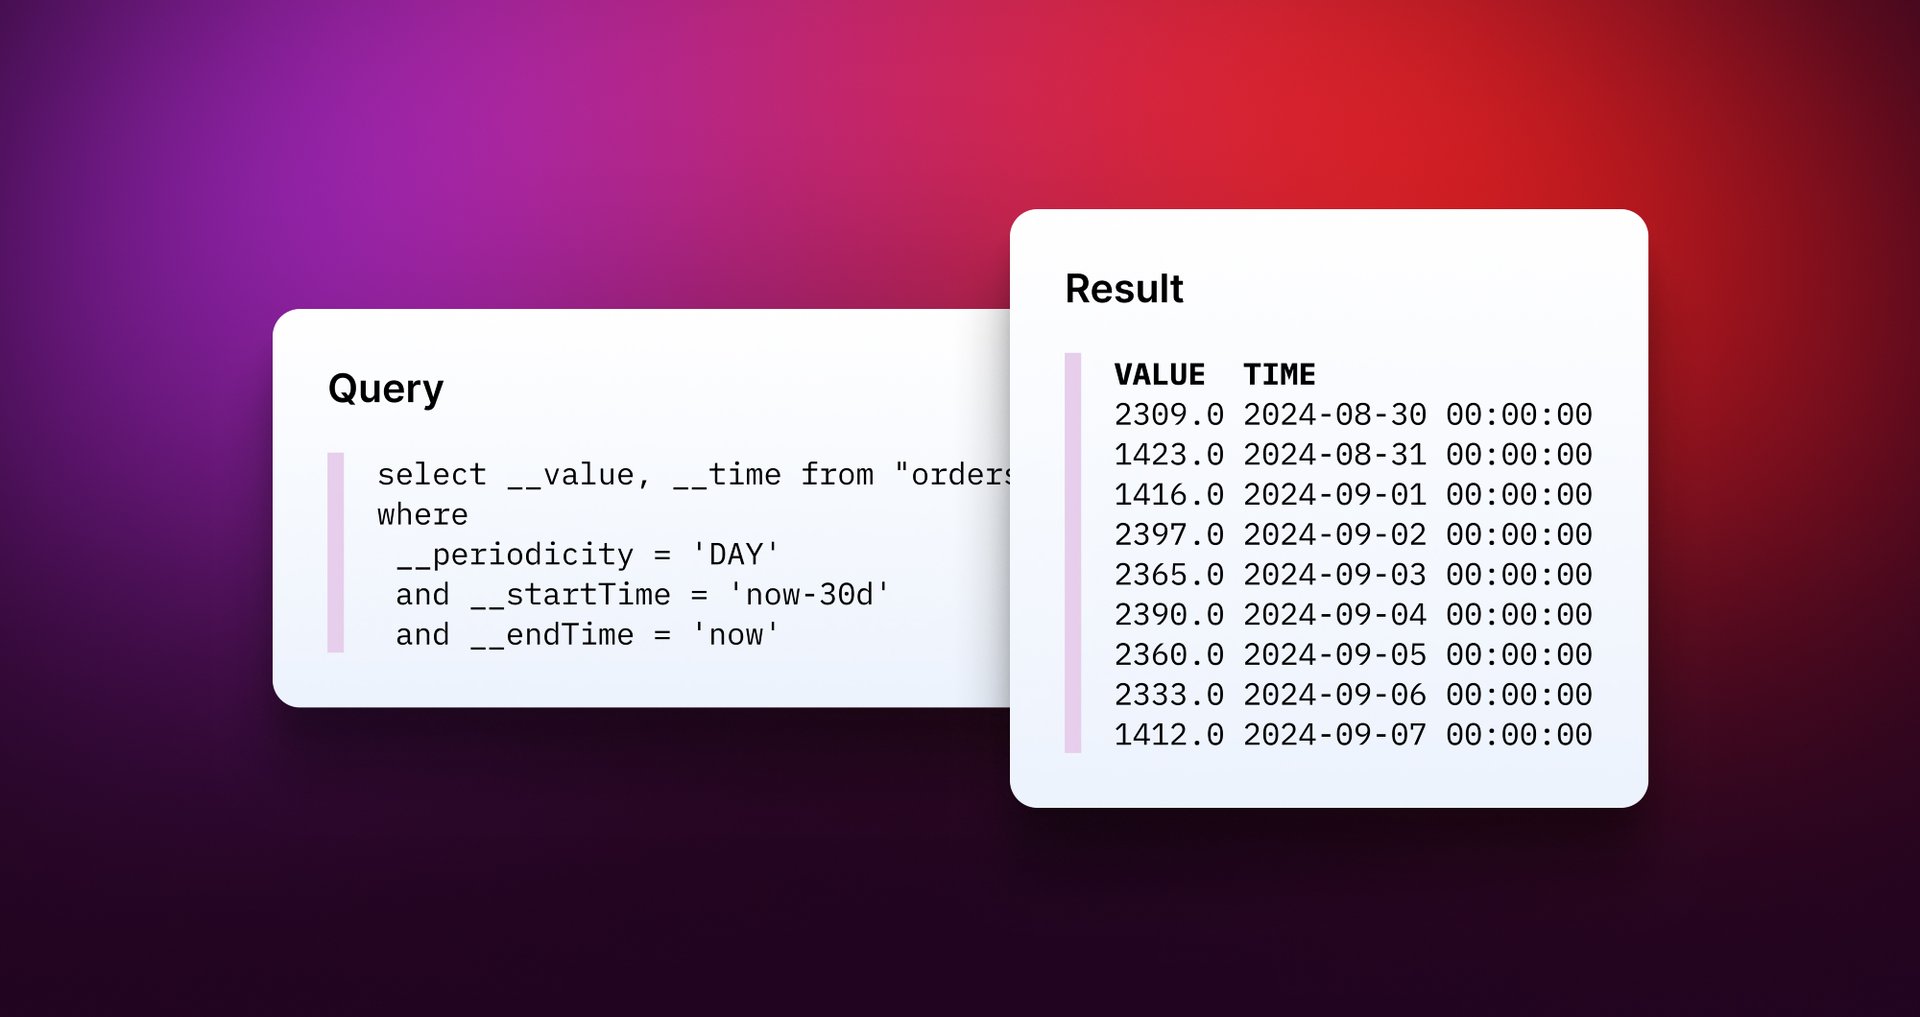
Query data directly from your data warehouse and get metrics on demand in real time.
.png)
.png)
.png)
A catalog of metrics
Manage metrics in
one place.
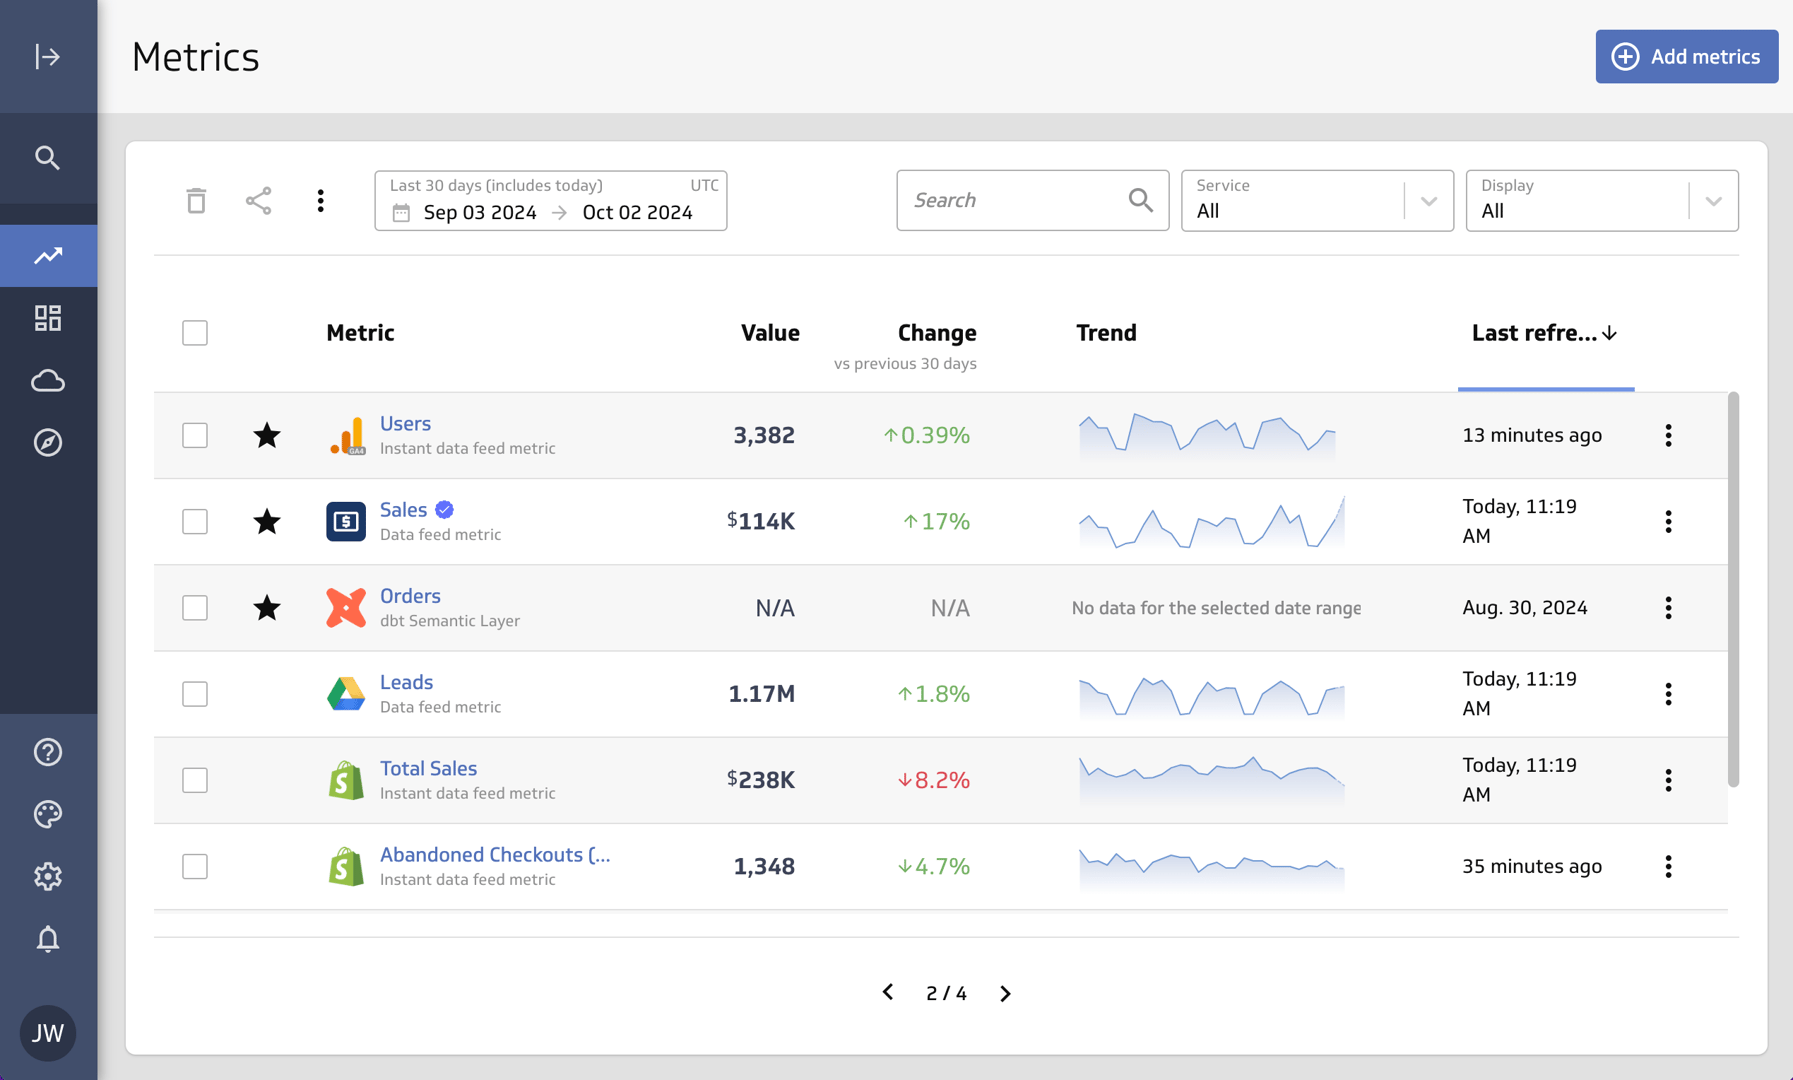
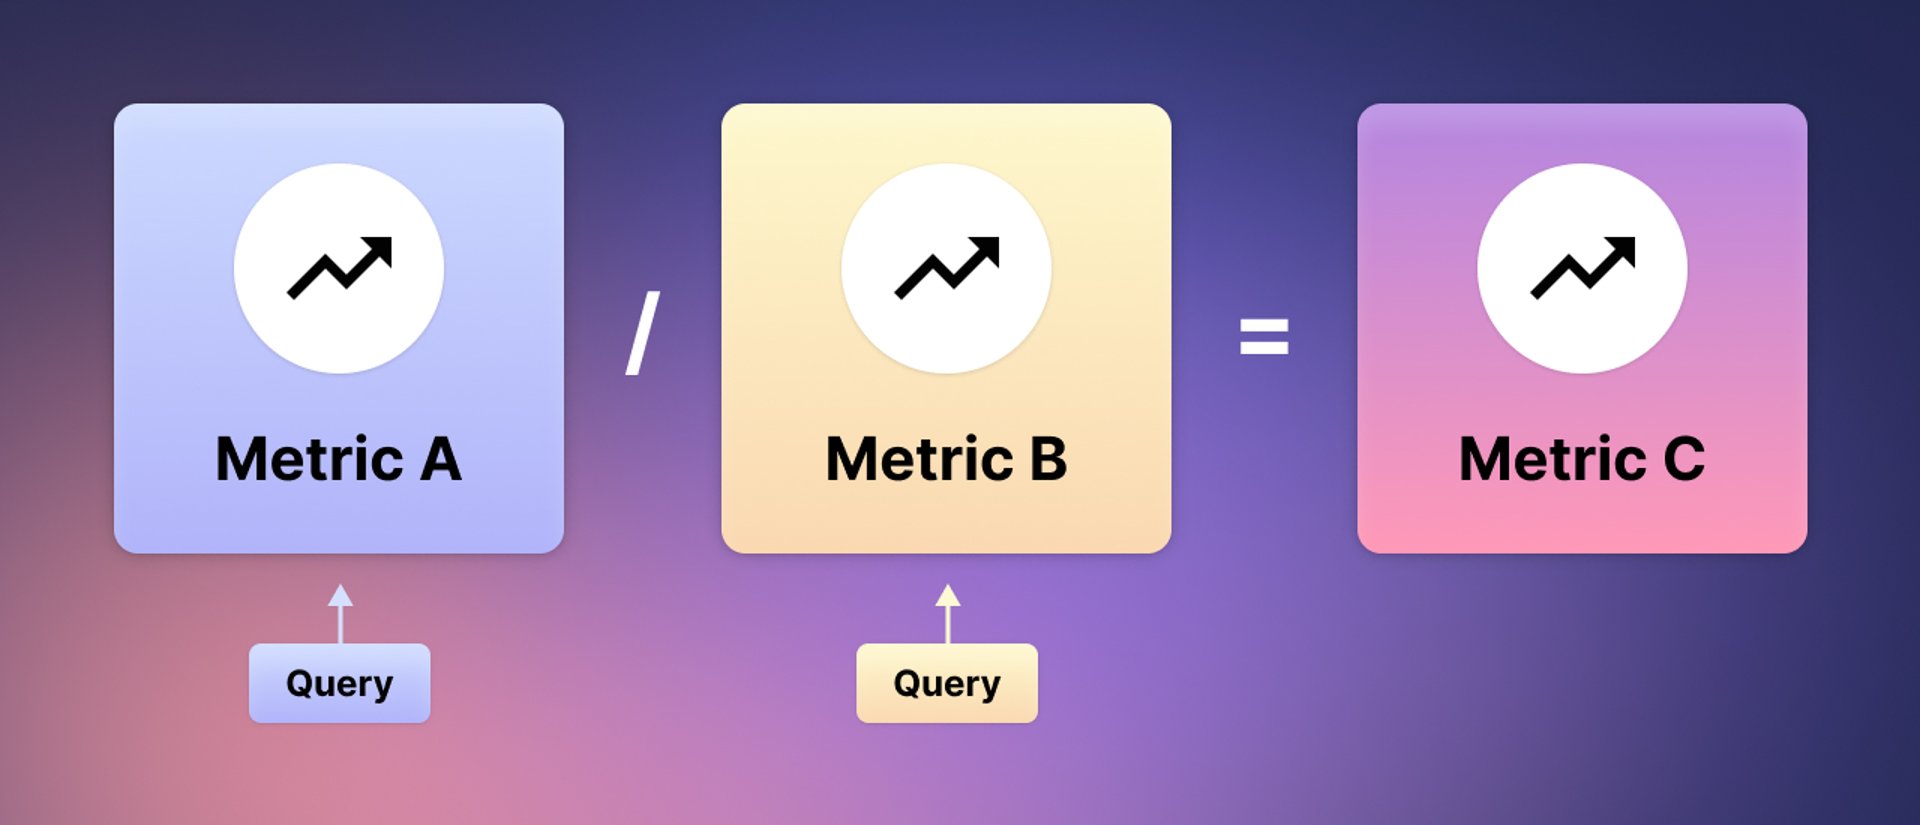
Keep everyone informed with a governed, centralized catalog of curated metrics and summarized overviews of data trends. Business users benefit from an all-in-one experience, enriched by the ability to combine metrics as calculations for even deeper insights.
Metric Management
Metric Governance
Metric Calculation
Find, view details for, and go to metrics via the metric catalog. A scorecard-like view provides an at-a-glance summary of your metrics’ status.
.png)
Independent analytics
Straightforward analytics for
everyone, everywhere.
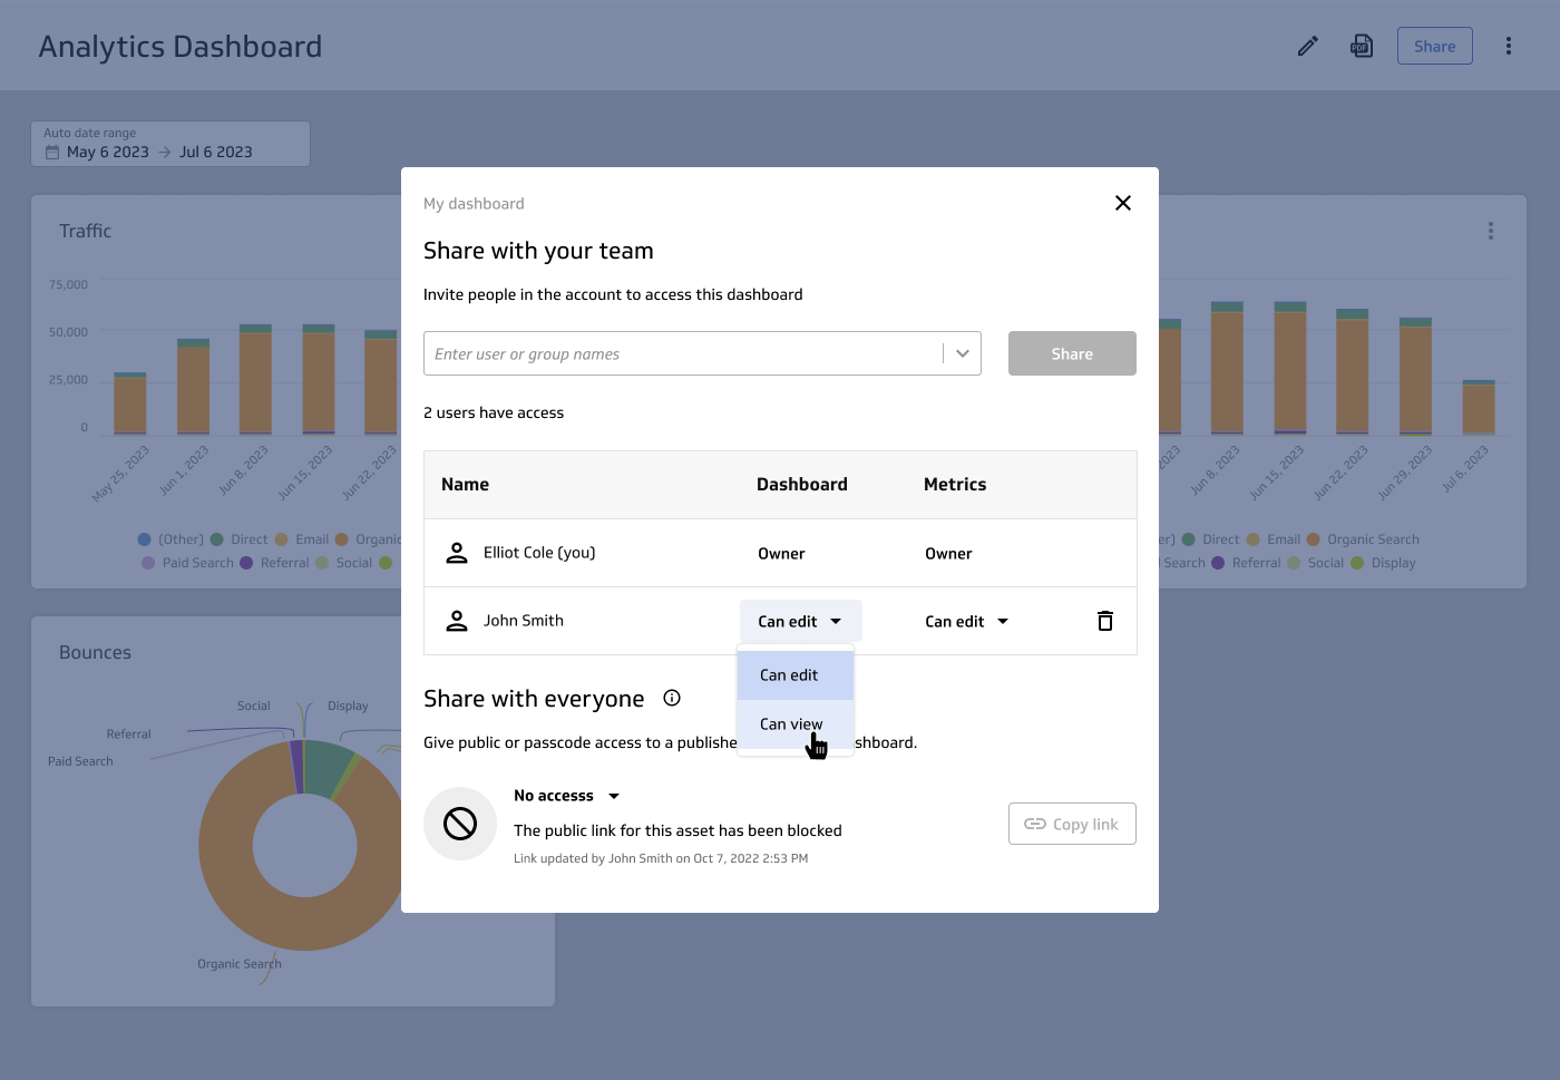
Our flexible design helps business users analyze data no matter where they work. For some, that’s in PowerMetrics, on a dashboard, metric homepage or in the Explorer (with optional help from PowerMetrics AI). For others, analysis takes place outside PowerMetrics, as live embeds or within alternate data tools.
Integrated Analytics
PowerMetrics AI
External Metric Consumption
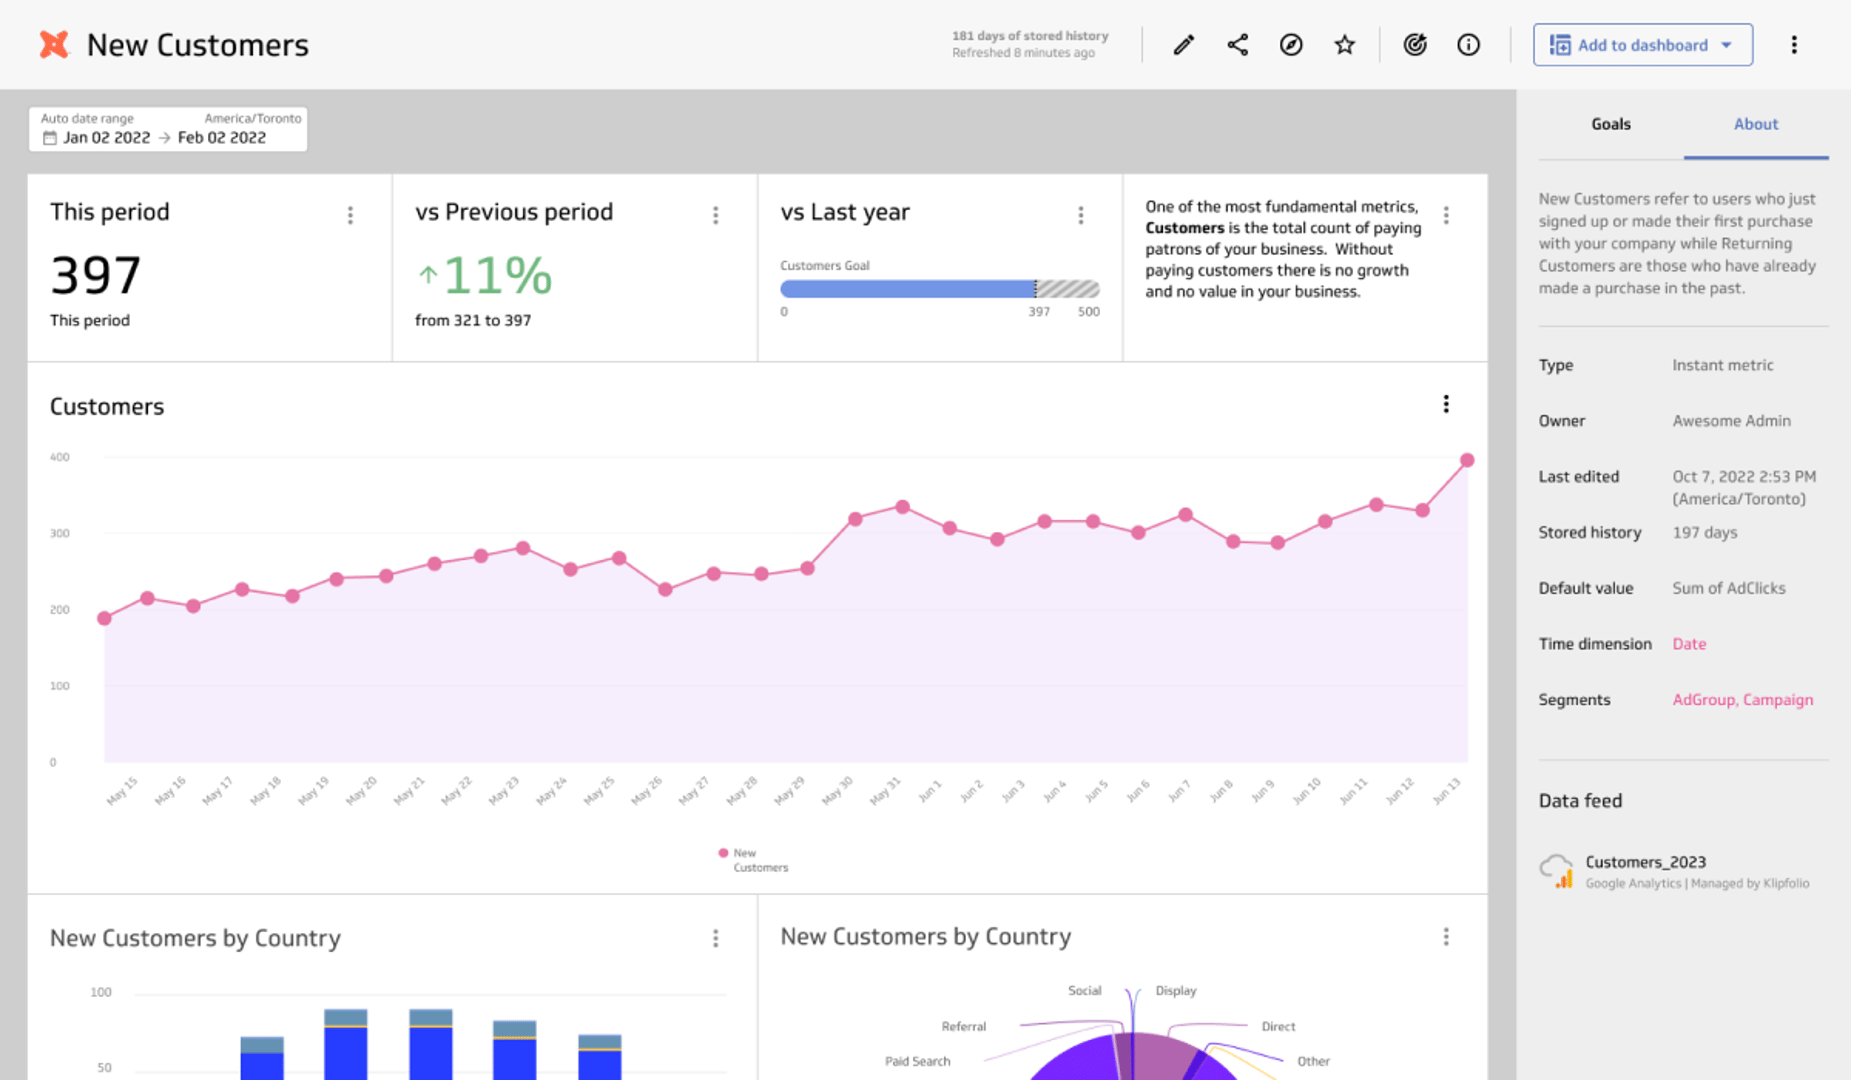
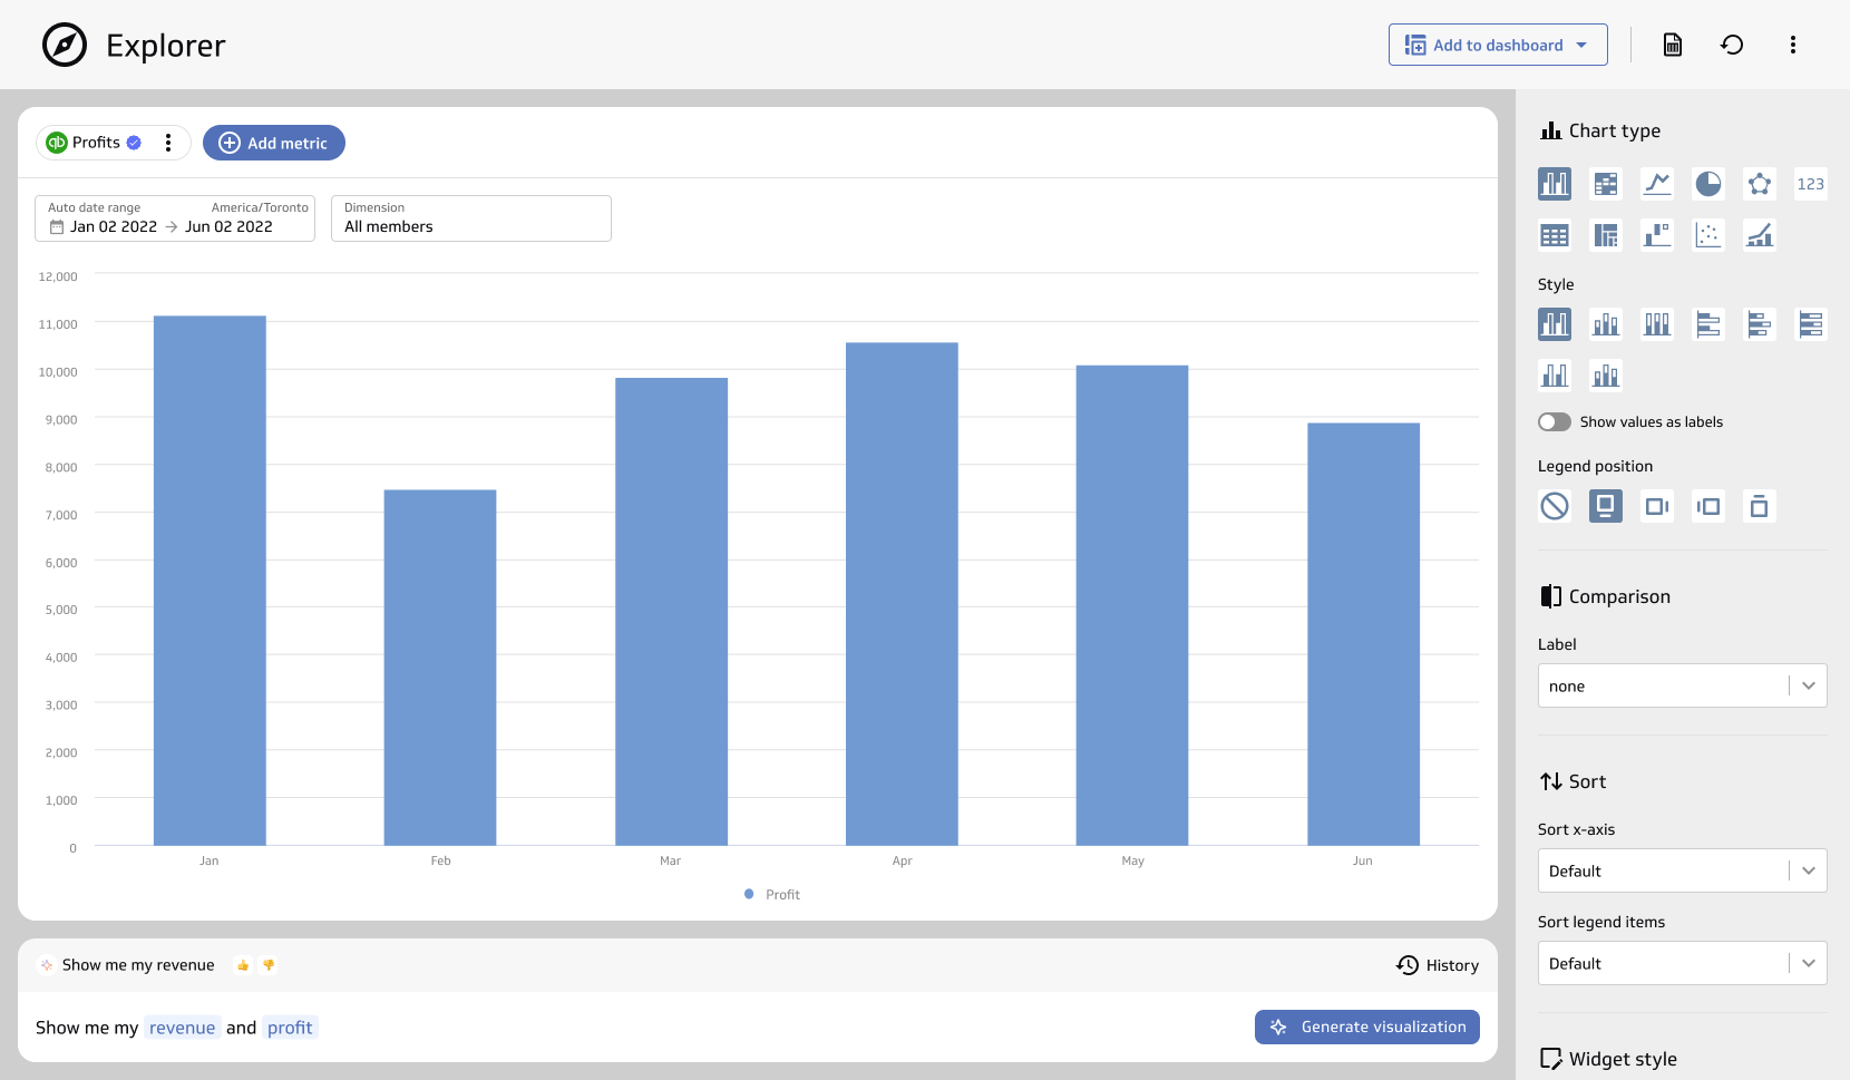
Streamlined, no-code analytics, designed for business users. Opportunities for discovery and insights abound, whether performing free-form analysis in the Explorer, monitoring trends in a metric homepage, or assembling dashboards and reports, PowerMetrics makes it easy to learn from and act on your data.
Save time, reduce risk, and get great results with Klipfolio Services.
Our data specialists and engineers will work with you to close gaps quickly and help deliver a solution that aligns with your business goals.

Onboarding and Training
With customized training plans, our experts will guide your team on how to get the most out of Klipfolio products and deliver the right data to the right people.

Implementation Services
We'll get it done together. Think of our experts as your extended team. From data stack integration to metric and dashboard creation, rely on us to get your system up and running.
Resources
What’s New
PowerMetrics evolves quickly. Stay up to date about our newest product releases.
Learn more