What is a TV dashboard?
Published 2024-10-14
Summary - A TV dashboard displays key metrics in real-time on a TV or wallboard, enabling teams to visualize their productivity and targets at all times.
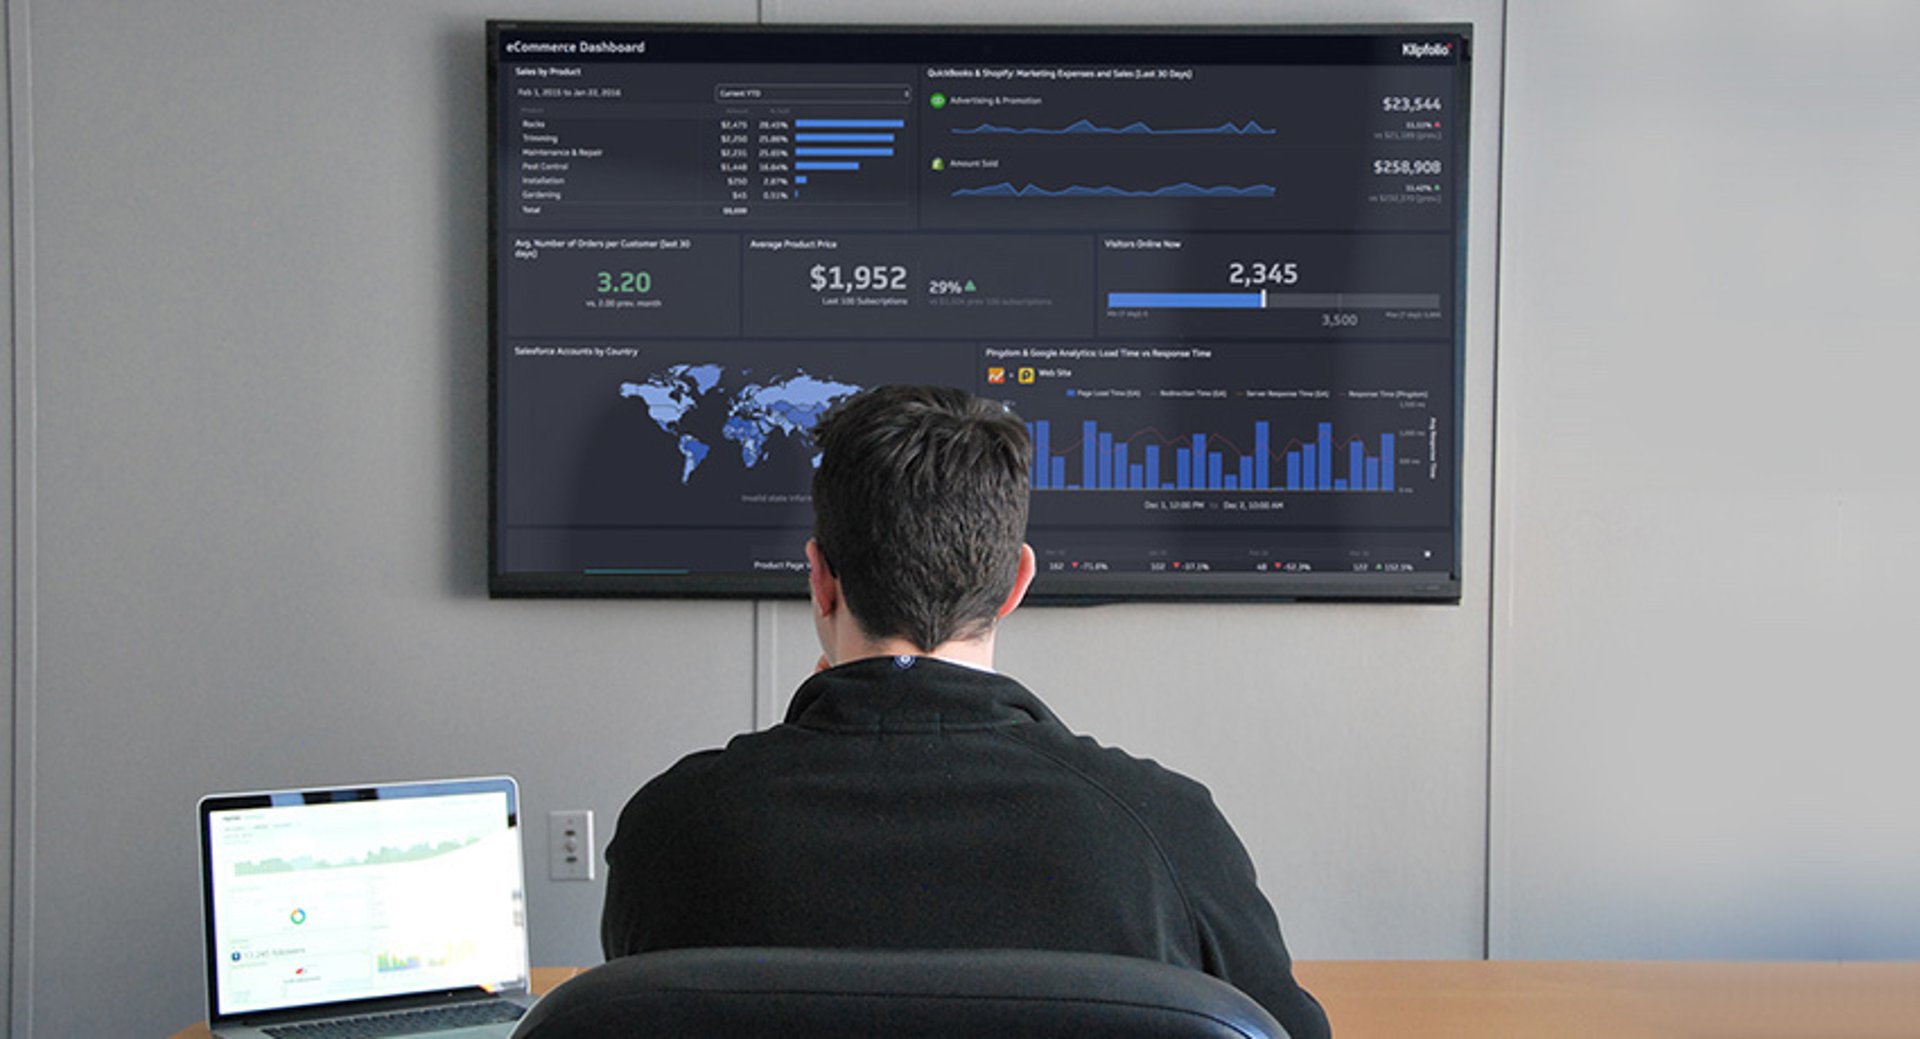
A TV dashboard displays key business metrics in real-time on a television or wallboard. TV dashboards have evolved over the years from office whiteboards, to office computer monitors, to TVs mounted on the wall. But all of them have one thing in common: it’s a way to display business metrics and KPIs. A TV dashboard enables teams to visualize their productivity and targets at all times. When the information is clear and accessible to everyone, business goals and objectives become a shared responsibility.
The benefits of a TV dashboard
You may be asking yourself, “but why do we need a TV dashboard if we can access the same information on a computer?” For a data-driven business to succeed, access to key data points at all times fuels performance. And there is no better way to both show and continue propelling that success than by setting up a TV dashboard. Additionally, TV dashboards:
- Improve data transparency across the business
- Promote departmental alignment by sharing metrics
- Nurture a culture of open communication around metrics and KPIs
- Foster data discussions against the backdrop of real-time data visualizations
- Quickly analyze performance to make business decisions and react in real-time
- Save time on ad-hoc reporting and meetings to share results
- Support cross-functional collaboration to achieve common goals
We have customers who set up TV dashboards in boardrooms, within departments, and even in their home offices for KPI reporting. When teams can see their performance at a glance, there is a new motivation to reach targets (and, frankly, more time to do it). The sky’s the limit when it comes to TV dashboards.
How to set up a TV dashboard
Now that we’ve covered the why when it comes to TV dashboards, let’s talk about how—the set up.
Setting up a TV dashboard is simple. Here are 6 easy steps to kickstart your journey to set up a TV dashboard.
- Determine your use case
- Select your dashboard software
- Pick your KPIs
- Design your dashboard
- Select your hardware
- Start casting and drive engagement
Determine your use case
You will have ideas as you build and design your dashboard, but it's important to first outline potential use cases.
Here are a few examples:
- Engage or inform foot traffic at your school, business or event
- Display your real-time business metrics for all to see
- Make it easier for departments within your business to align around goals
From there, you'll want to break these down into specifics. For example, let's say you want your sales team to monitor individual and team performance metrics. Sketch out what the best sales dashboard for your team might look like before you begin to build it.
Select your dashboard software
What software will you use to display your dashboard on a TV? You’ll want to take into consideration the flexibility, UX, and price of the dashboard software.
Here’s what to look for:
- How does the dashboard software look on a TV?
- How easy is it to put the dashboard into TV mode?
- Is there a mobile version? Desktop version?
- Does the dashboard software support custom CSS?
- How does the vendor account for multi-tenancy and licensing fees?
Since you’re on the Klipfolio blog, and we’re confident you’ll like our software, we’ll use our own platform for this example. You can start your free trial account here and follow along step by step or visit our pricing page for more details.
Pick your KPIs
Monitoring the health of your business involves tracking different metrics. Pick your KPIs based on your goals and what you want to communicate to the organization. Often, there are too many metrics to put on one dashboard. If you find yourself in this situation, it may be worth considering more than one TV dashboard in your office.
TV dashboard tip: Organize your dashboards by role or department so it’s easy to understand and access the data.
Design your dashboard
A beautiful TV dashboard means the dashboard software itself is optimized for the experience, but it also means you've taken the time to learn the best practices of building and designing dashboards.
If you’ve started a free trial and you’re not sure where to start, use our Dashboard Gallery and Klip Gallery to quickly build out a dashboard with your data. For example, you can set up a rich Salesforce dashboard in just a few minutes.
You’ll likely want to customize your dashboard as you go, but we like quick wins—particularly when it comes to getting team or company-wide buy-in to display TV dashboards in your office.
A well-designed dashboard speaks volumes. In a single screen, you can display your data that otherwise lives in multiple spreadsheets and browser tabs. And, if you pull your data dynamically, it will update in real-time so you’ll never have to open the spreadsheets or tabs again!
It’s also important to note that your TV dashboard should be placed in close proximity to the team it is intended to guide. If you have multiple dashboards, place them adjacent to where that team is in the office. Alternatively, if you have a smaller office and/or team, consider setting up your TV dashboard in a common area and display the dashboards on an automatic rotation. Remember, TV dashboards are intended to drive performance, not divert attention.
Dashboard design tips
Trim content on the dashboard
It can be difficult to see and understand the details that you’d have on a typical dashboard when it’s displayed on a TV. Consider making a version of your dashboard intended for TV display only. Reduce the clutter on the dashboard and stick to the essential information that is easy to read at a glance.
Adjust your browser zoom level
For televisions with viewers within 20 feet of the TV, zoom in to 150% to 175% for ideal viewing.
Use suffixes for large numbers
Use suffixes for easy reading. For example, use $34.2M instead of $34,231,342.23.
Make heights consistent
It can be visually jarring to follow the peaks and valleys of metric alignment. Strive for consistency with height and spacing to enhance readability.
Select your hardware
Rise Vision
Rise Vision is a web-based digital signage platform. It allows you to display dashboards, calendars, spreadsheets, webpages, RSS feeds, and YouTube videos. All you need is a media player, some kind of display monitor, and a free account. Rise Vision supports Windows, Linux, Chrome, and Raspberry Pi media players.
Ideal for: Rise Vision is great for organizations who want a simple way to show dashboards and manage their displays from an easy-to-use web app.
Airtame
Airtame is a small wireless HDMI device that plugs into the HDMI port of any TV screen or projector. It allows you to stream content to the TV from any computer, tablet, or smartphone.
Ideal for: Airtame is ideal for schools and businesses that need an easy way to both stream content and display dashboards to a shared TV/projector.
Additionally, Chromecast and Apple TV work in the same capacity.
Start casting and drive engagement
We’ve all shared a document, sent an email, or made a phone call without getting any kind of response.
Don’t deploy your dashboard to an unresponsive audience!
Check in with your team at every step of the way by including them in those early "sketch" conversations and by giving them a detailed walk-through of how best you want them (or your shared audiences) to engage with the TV dashboard.
If you're using a TV dashboard to make data-driven decisions to help drive your business forward, challenge each team to take ownership of what they see and improve their numbers. For that, you will need to dive into your key performance indicators and get to the heart of what you want to measure, track, and improve.
Dashboard examples you can use today
Marketing TV dashboard
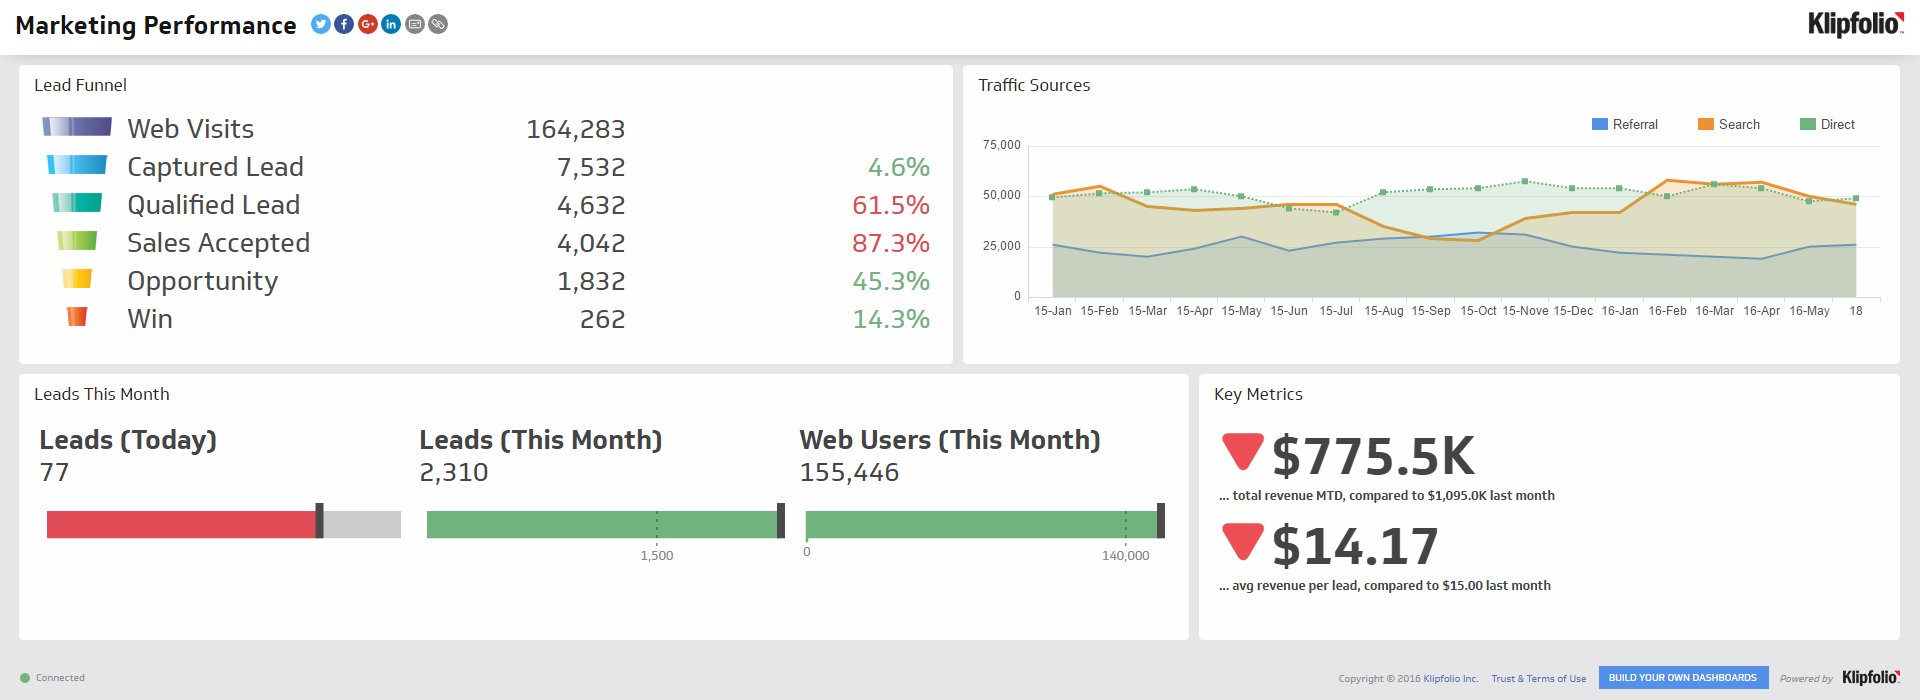
Marketing teams typically have multiple dashboards ranging from web analytics metrics to email marketing KPIs and everything in between. Make sure your marketing dashboard displays the metrics that have a direct impact on your team’s day to day performance. View Klipfolio's live Marketing Dashboards.
Developer TV dashboard

This Developer dashboard displays a project burndown and release tracker to keep the DevOps team on the same page. This TV dashboard also displays unresolved issues, WIP limits, and feature versus bug investment to monitor website performance and tackle any issues that come up right away. View Klipfolio's live DevOps Dashboard.
Sales TV dashboard
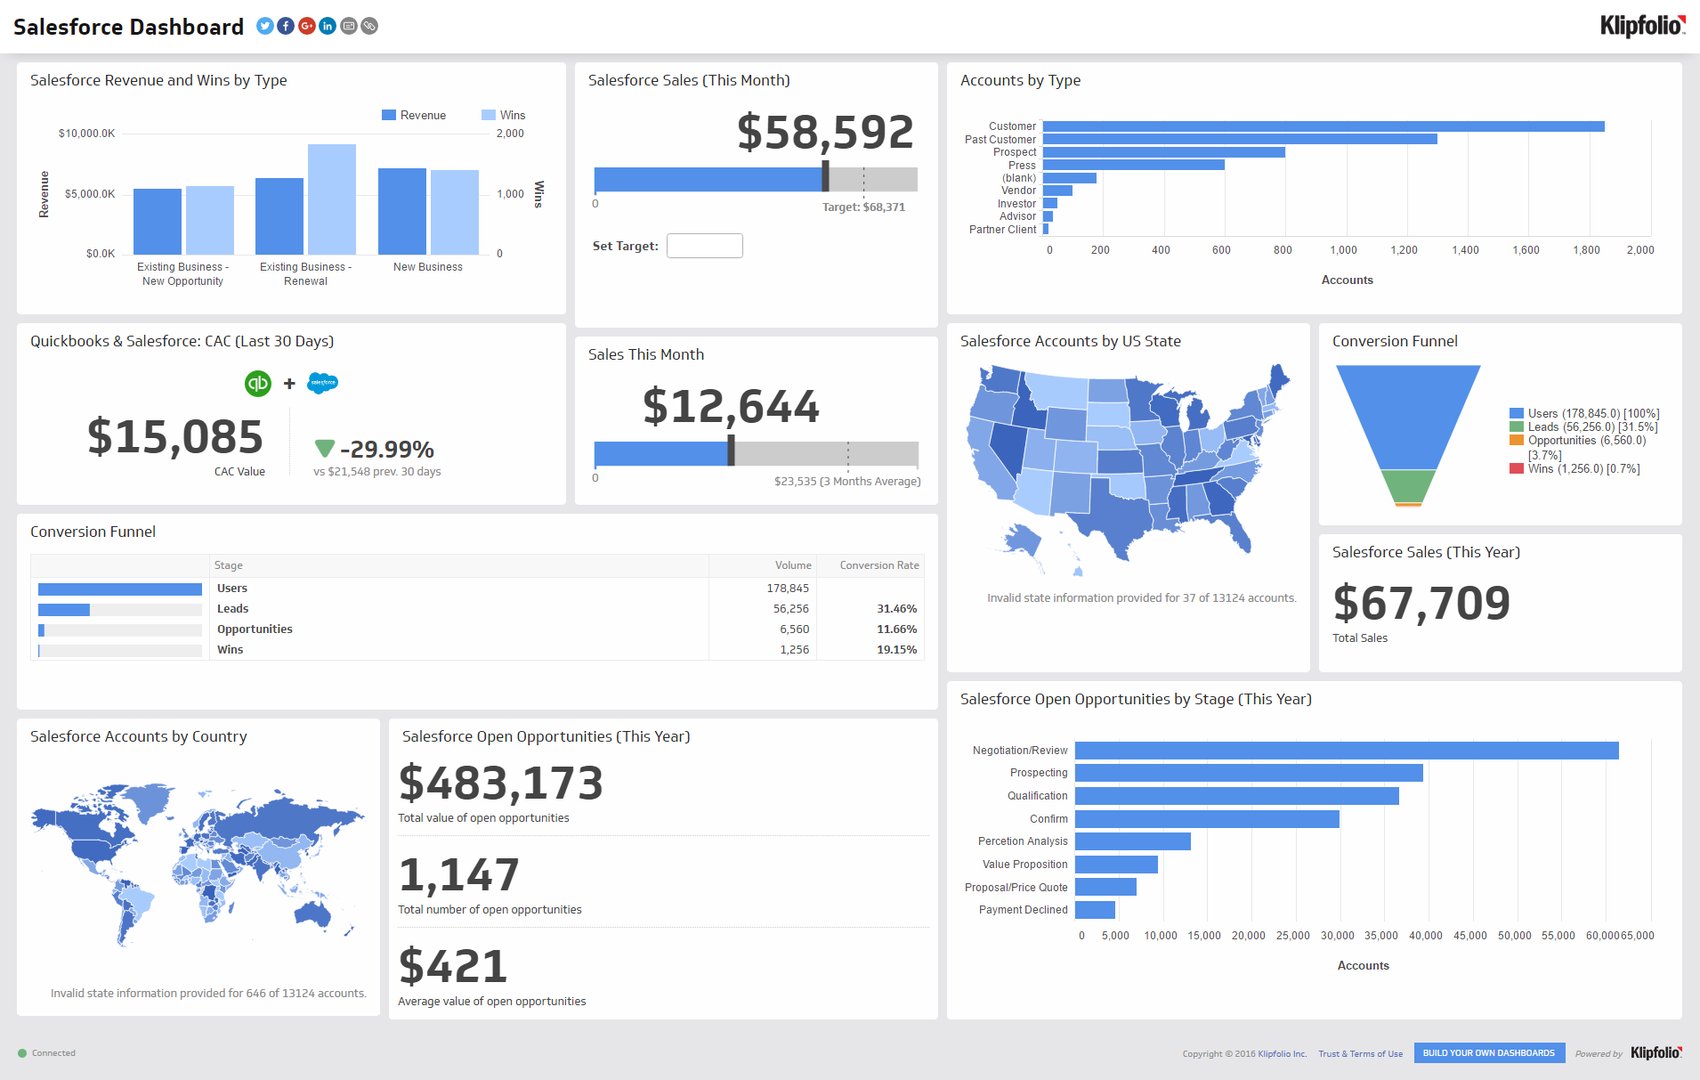
Sales teams operate in a fast-paced, high-pressure environment that demands they stay up-to-the-minute on the latest opportunities and challenges. The following example is our Salesforce Dashboard.
Salesforce is an automated CRM solution. Sales teams want to be dialed into the latest opportunities, notified when an important deal is closed, and know the status of new leads. And most of all, your sales team wants that data to be in real-time and easily accessible. View Klipfolio's live Salesforce Dashboard.
Related Articles
Metrics provide rich context for better AI: Introducing the new PowerMetrics AI experience
By David Mennie — June 21st, 2024
Partner Case Study: Eyeful
By Cathrin Schneider — May 21st, 2024
Partner Case Study: The Project Booth
By Cathrin Schneider — April 11th, 2024