The data analyst’s tool for building real-time BI dashboards and reports
The control you want, the data you need
Track your data analysts KPIs in minutes
Sign up for free and start making decisions for your business with confidence.

Klipfolio is a different type of reporting tool for data analysts
Unlike BI tools focused on data sources that live on premise, or cloud tools that can only access cloud services and spreadsheets, Klipfolio’s open and flexible design enables connections to all types of data, wherever it lives.
With Klipfolio you can:
- Connect to virtually any data source you’ve got, on prem or in the cloud, in a SQL database or on an FTP server, in a Google Drive or on a hard drive. Browse all the data sources we support on our Integrations page
- Directly manipulate, mashup and visualize data sets in a powerful editor, leveraging dozens of functions, math operations and statistics
- Set the data you’re pulling into Klipfolio to refresh as frequently as every minute (for APIs that allow it)
- Easily share dashboards via email, Slack, published links, or by adding users
- Monitor dashboards on large screen TVs and on mobile phones
Learn more about all the features of Klipfolio here.
Data Analysts dashboard examples
Curious to see what data analysts data you can track in Klipfolio? View these live dashboard examples to get a better look.

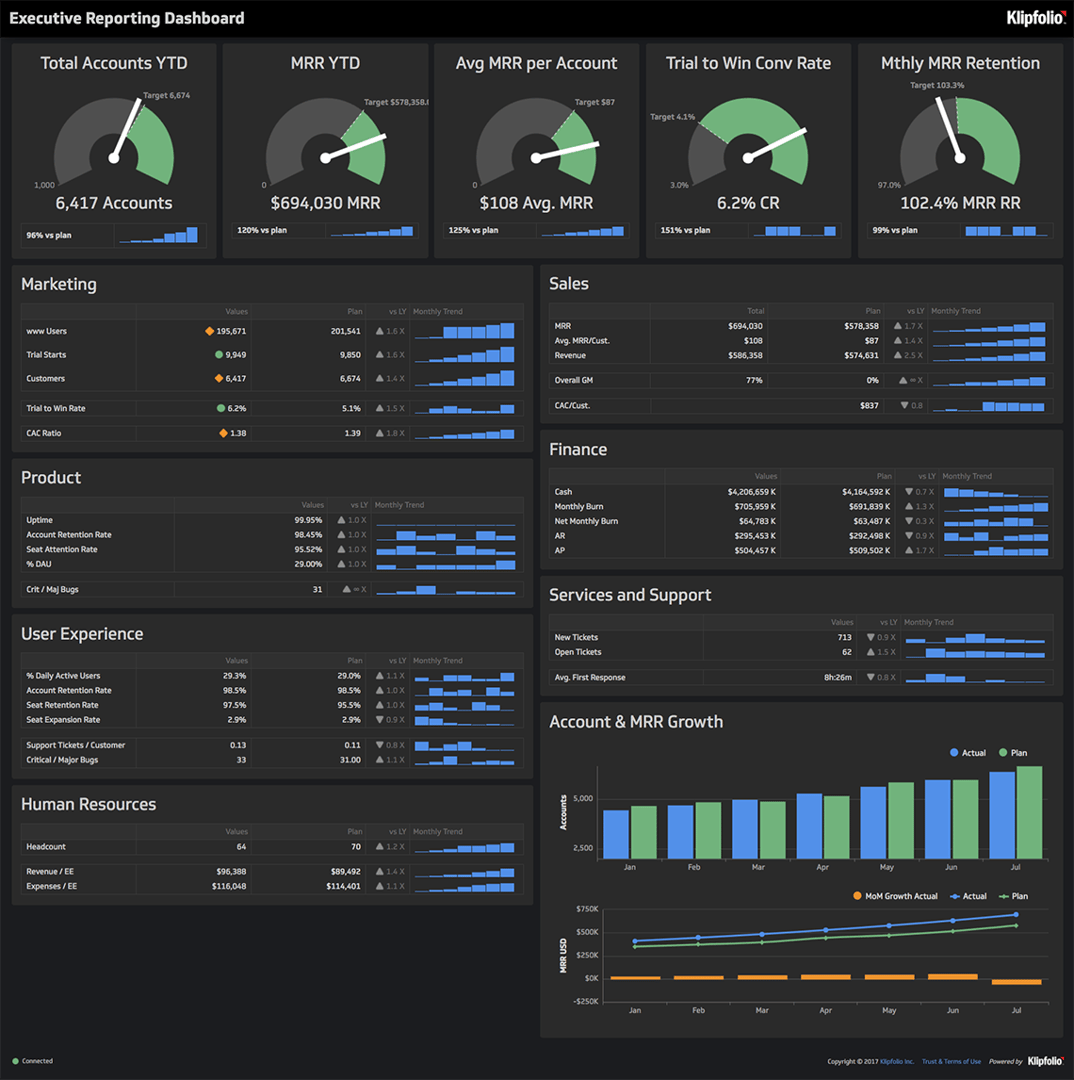
Executive Reporting Dashboard
- At-a-glance view of each department's performance
- Track key metrics like accounts, MRR, and conversion rates in one interactive dashboard
- Easily share key departmental metrics with shareholders

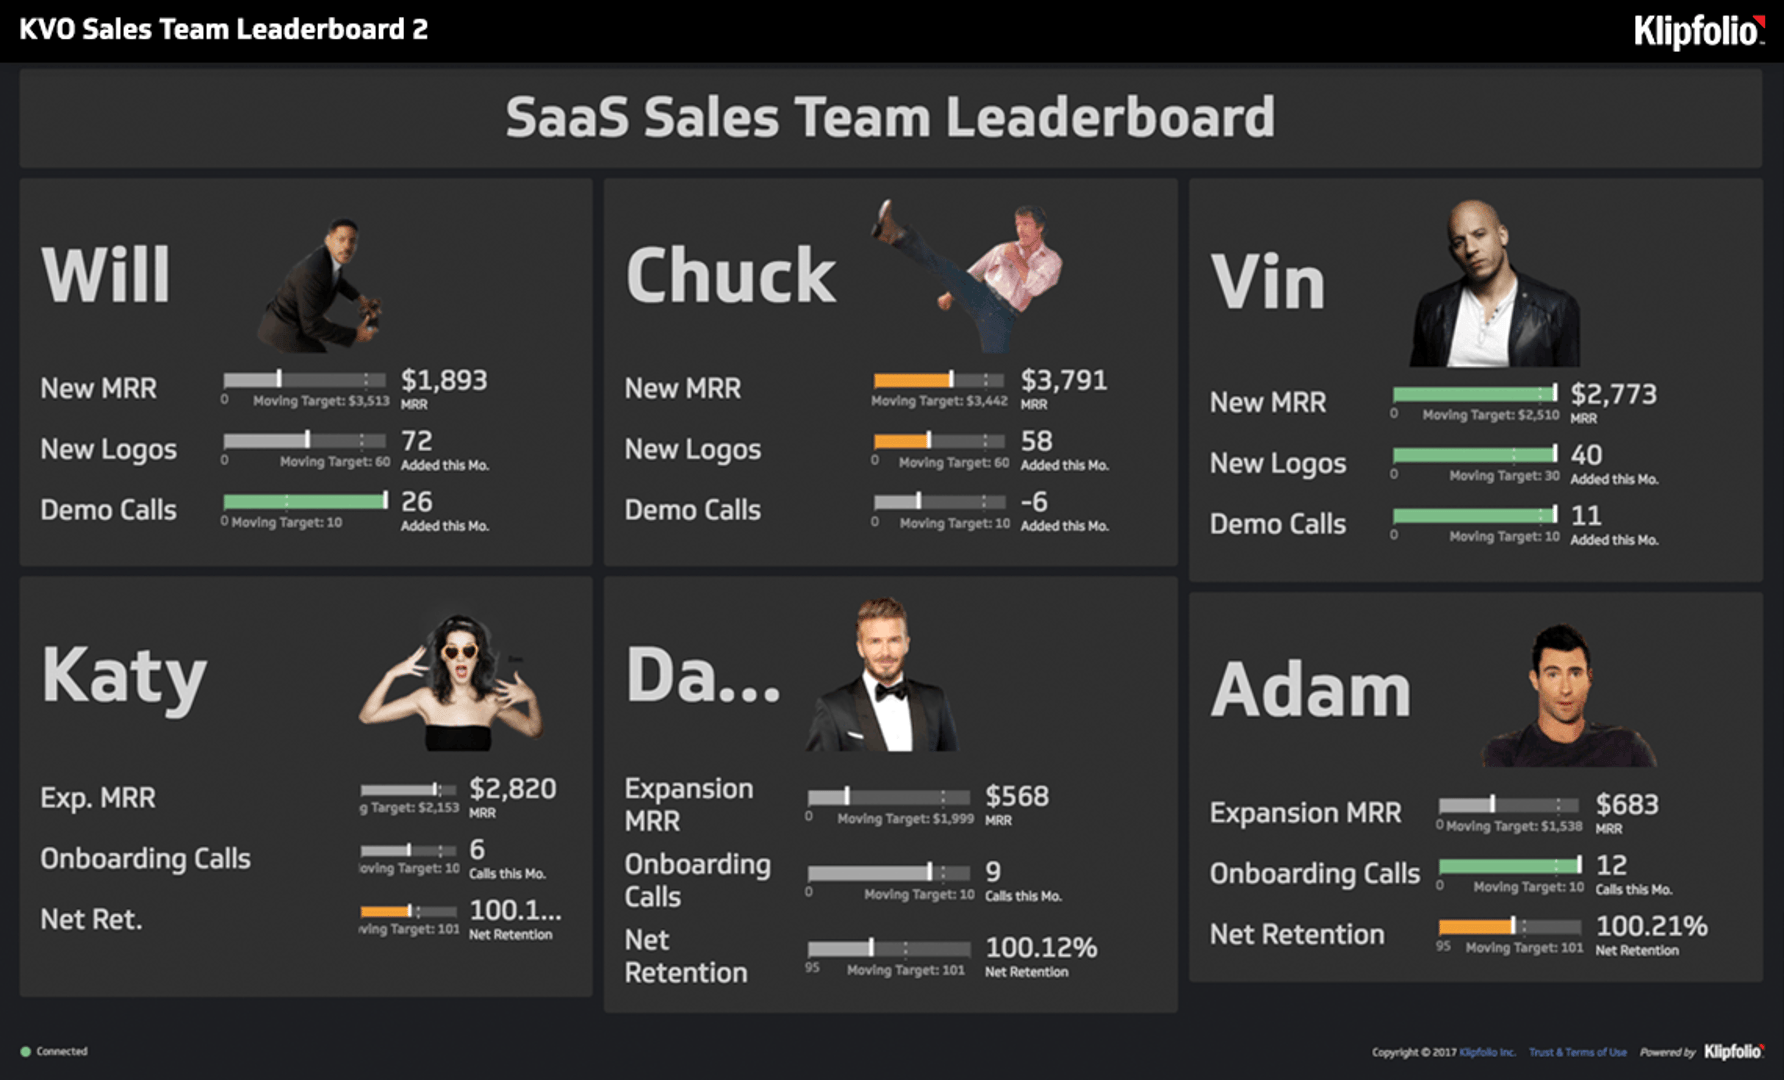
Sales Team Leaderboard
- Motivate your sales team with a real-time leaderboard
- Track new MRR, new logos, and demo calls
- Create an open culture and competitive nature to drive up sales
Klipfolio is free to try, and trials are fully supported
We want you to experience the value of Klipfolio before you purchase. That’s why, from day one of your free trial, you’ll have full access to our support team, knowledge base and courses.
With Klipfolio you can:
- Leverage live, rockstar support, online or over the phone
- Check out our Knowledge Base to find answers to common questions and challenges
- Checkout one of our YouTube tutorial playlists like how to build dashboards with database data
Learn more about all the features of Klipfolio here.
Discover data analytics delight
50,000 Data-Driven users rely upon Klipfolio because it empowers them to easily build the data visualizations they need without all the baggage traditional BI tools requires.
Connecting your data
You’ve got an impressive amount of data scattered around your organization, but how do those puzzle pieces fit together? Klipfolio is an API machine with 100s of connections to the digital advertising services you use to help grow your business.
Browse the 100+ services you can connect to
The Editor
Love to tinker and build but tired of using Excel or Google Sheets to share your key results and metrics? The Klip Editor is where you bring your data story to life. Build custom data visualizations that you can share with your whole organization.
Bring your data story to life
Drag-and-drop visualizations from the palette to start assembling your custom dashboard. Choose from standard data visualizations like charts, bullet charts, and scatter plots. Or get creative and inject custom HTML into your dashboard. The choice is yours.
Sharing
Data is meant to be shared. A dashboard without any viewers is, well, kind of sad. Wouldn’t you agree?
Which is exactly why we make sure you can share with your management and teams in multiple ways.
TV dashboard display
Our customers love showing off their dashboards on wall-mounted TVs throughout the office. It’s a great way for executives to nurture a culture of data transparency and the team to see their performance at a glance. Plus, it looks super cool.
Slack, email snapshots, and links
Send Klips or entire dashboards via Slack, setup manual or recurring email snapshots, and share links to your live dashboard.
