Call Center Metrics Dashboard
Track your team's performance and improve service in real time.
What is a Call Center Metrics Dashboard?
A Call Center Metrics Dashboard is a reporting tool that pulls all your key performance indicators (KPIs) into one place. Instead of digging through different systems or static spreadsheets, your whole team sees the same data in real time. This helps managers and agents monitor performance, spot issues like high wait times, and coordinate responses to sudden call surges before they get out of hand.
Why track call center performance on a dashboard?
If you manage a growing team, you're likely buried in data. Your call data sits in one system, agent schedules in another, and customer satisfaction (CSAT) scores in a third. Manually pulling all of this into a spreadsheet for a weekly report is time-consuming and prone to errors.
A live dashboard connects these scattered sources automatically. It gives your entire team a single source of truth, from front-line agents checking their queue to executives monitoring overall operational health.
Key call center KPIs for your dashboard
A great call center dashboard balances metrics for efficiency, quality, and overall operations. Here are some of the most important KPIs to include:
Agent and efficiency metrics
Average Handle Time (AHT): The average time an agent spends on a call, including talk time, hold time, and follow-up work. A high AHT may point to a need for better training or simpler processes.
Agent Occupancy: The percentage of time agents are actively engaged in call-related work versus waiting for calls. This helps you improve staffing levels.
Agent Utilization: The percentage of an agent's paid time spent on call-related activities. This gives you a broader view of productivity.
Service level and quality metrics
Service Level: The percentage of calls answered within a specific timeframe (for example, 80% of calls answered in 20 seconds). This is a core measure of accessibility.
Average Speed of Answer (ASA): How quickly, on average, a call is answered by an agent. A low ASA is essential for a positive customer experience.
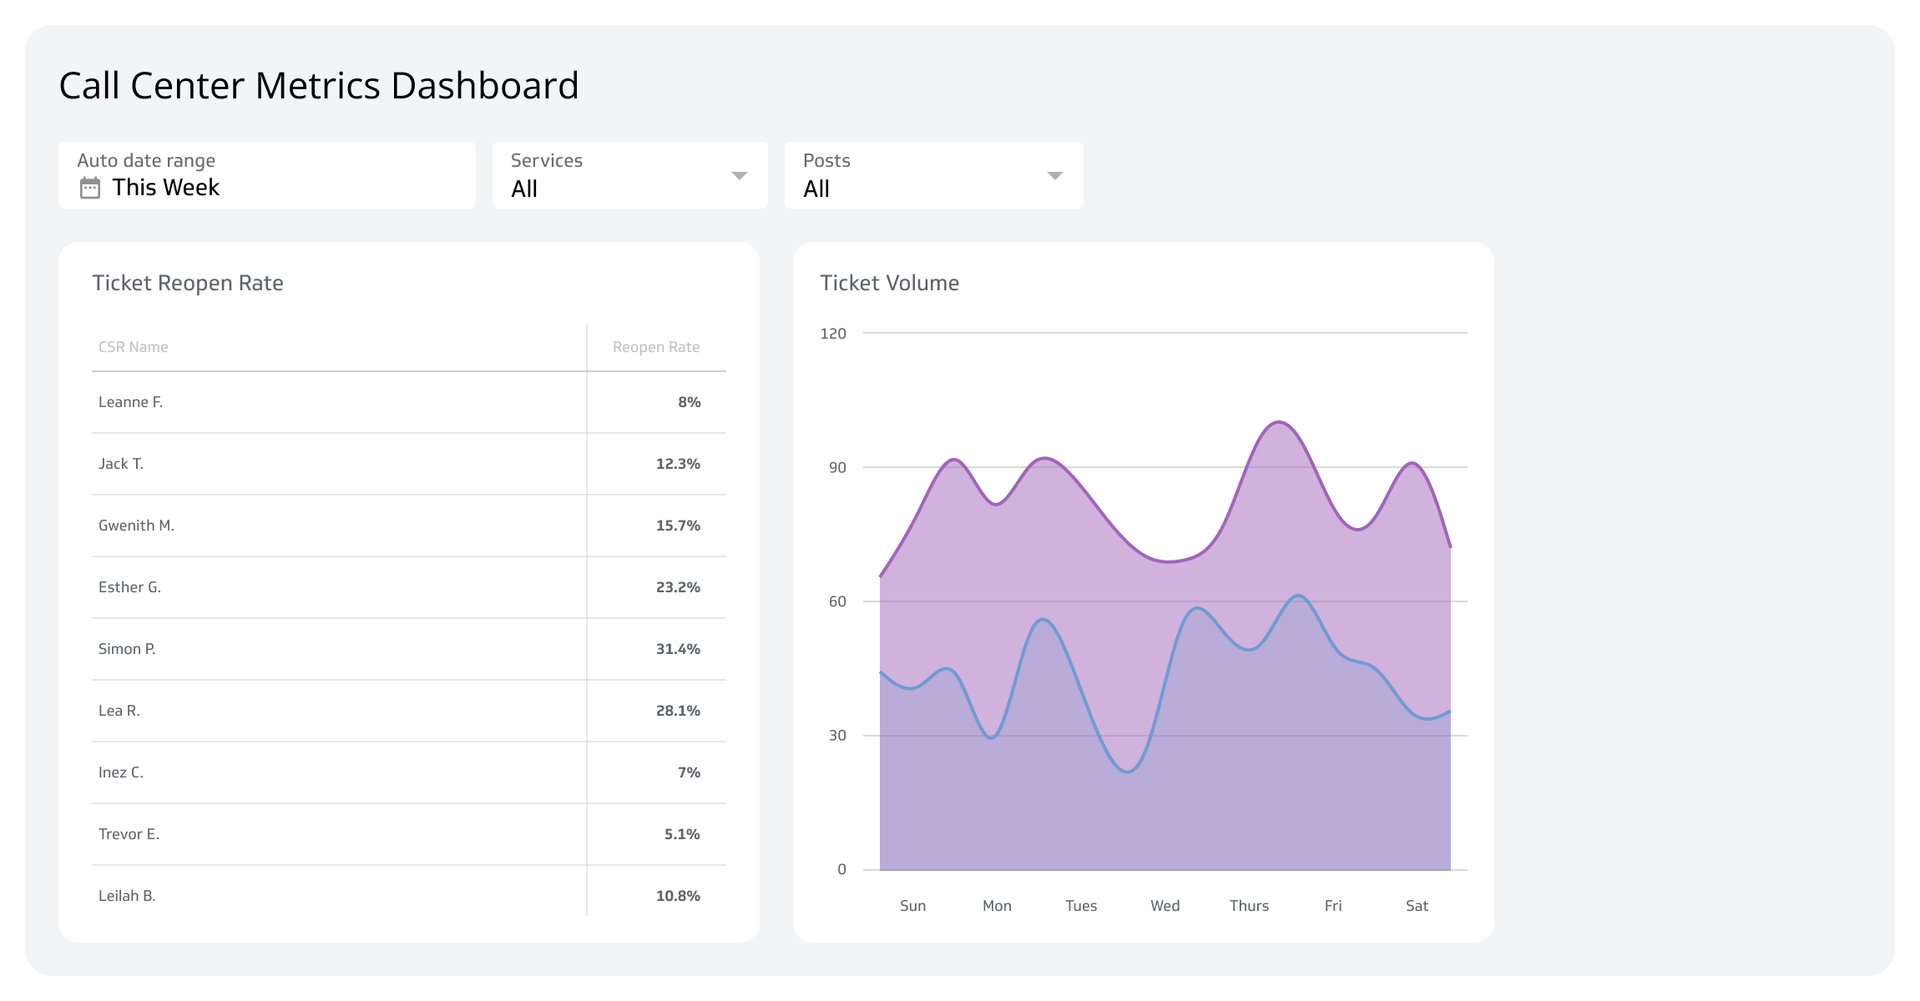
Abandonment Rate: The percentage of callers who hang up before connecting with an agent. High rates often signal wait times are too long.
Customer Satisfaction (CSAT): A measure of customer happiness, typically captured through post-call surveys. This directly links call center performance to business outcomes.
Operational and status metrics
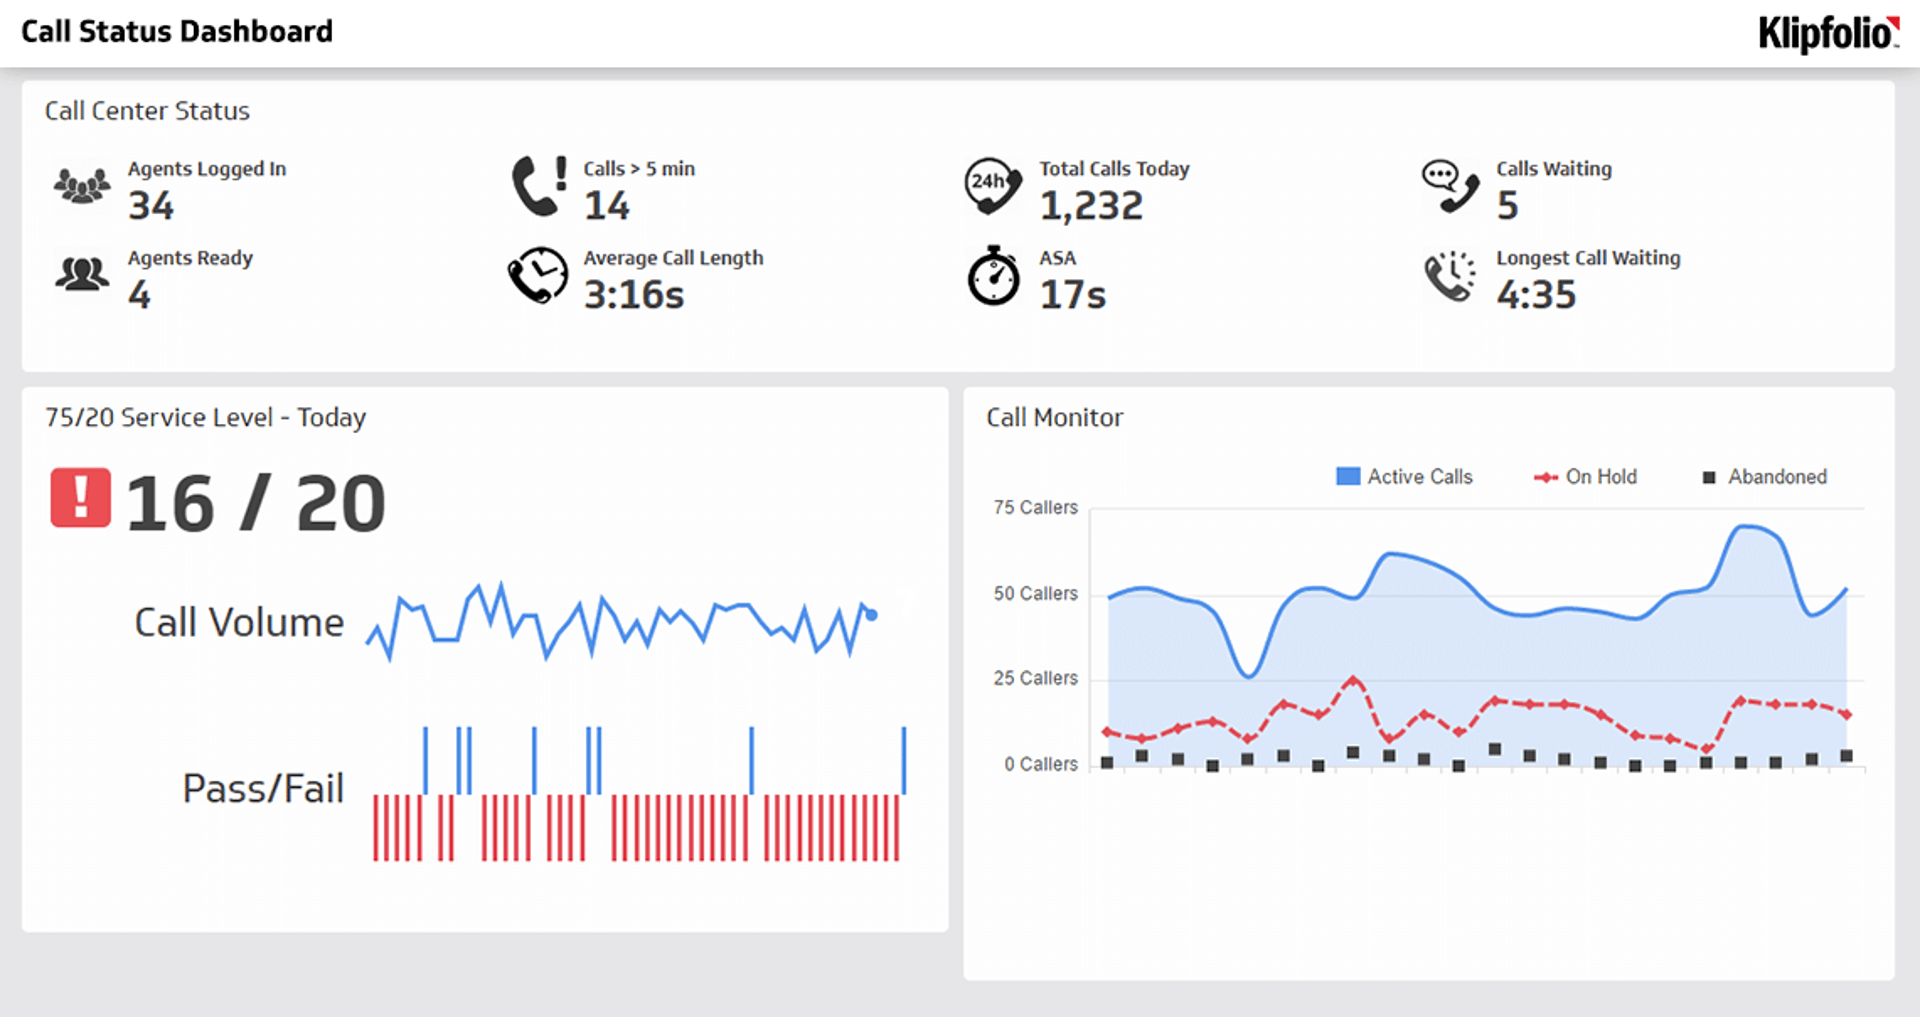
Call Status: A real-time count of calls in queue, calls in progress, and available agents. This is vital for on-the-fly shift management.
First Call Resolution: The percentage of customer issues resolved on the first contact. A high FCR rate reduces costs and improves customer loyalty.
Cost Per Call (CPC): The total operational cost of the call center divided by the total number of calls. This is a critical financial metric for managing operations.
Who uses a call center dashboard?
Dashboards aren't just for executives. Different roles need different views:
Call center agents use it to monitor their personal queue, track their First Call Resolution rate, and see how they compare to team averages.
Team leaders and managers track team-wide service levels, identify agents who need coaching, and manage daily staffing based on call volume.
Executives get a high-level view of overall performance, focusing on KPIs like total call volume, CSAT scores, and Cost Per Call to guide strategic decisions.
Ready to stop guessing and start knowing? A dashboard brings all your data together, giving your team the clarity and alignment needed to deliver exceptional service. Build your own call center dashboard and get everyone on the same page with Klipfolio Klips.
At a glance
Focus Area
Call center performance monitoring, KPI tracking, agent efficiency, service level management
Metrics List
AHT, FCR, CSAT, Service Level, ASA, Abandonment Rate, Agent Occupancy, Agent Utilization, Cost Per Call, Call Status
Reference Rate
Real-time, daily, weekly, monthly
Related Dashboards
View all dashboards