
Impress your clients with
beautiful custom dashboards
With powerful client management, pipeline automation, and pixel-perfect dashboards and reports, your clients will love what you love building in Klipfolio Klips.
Get started with Klips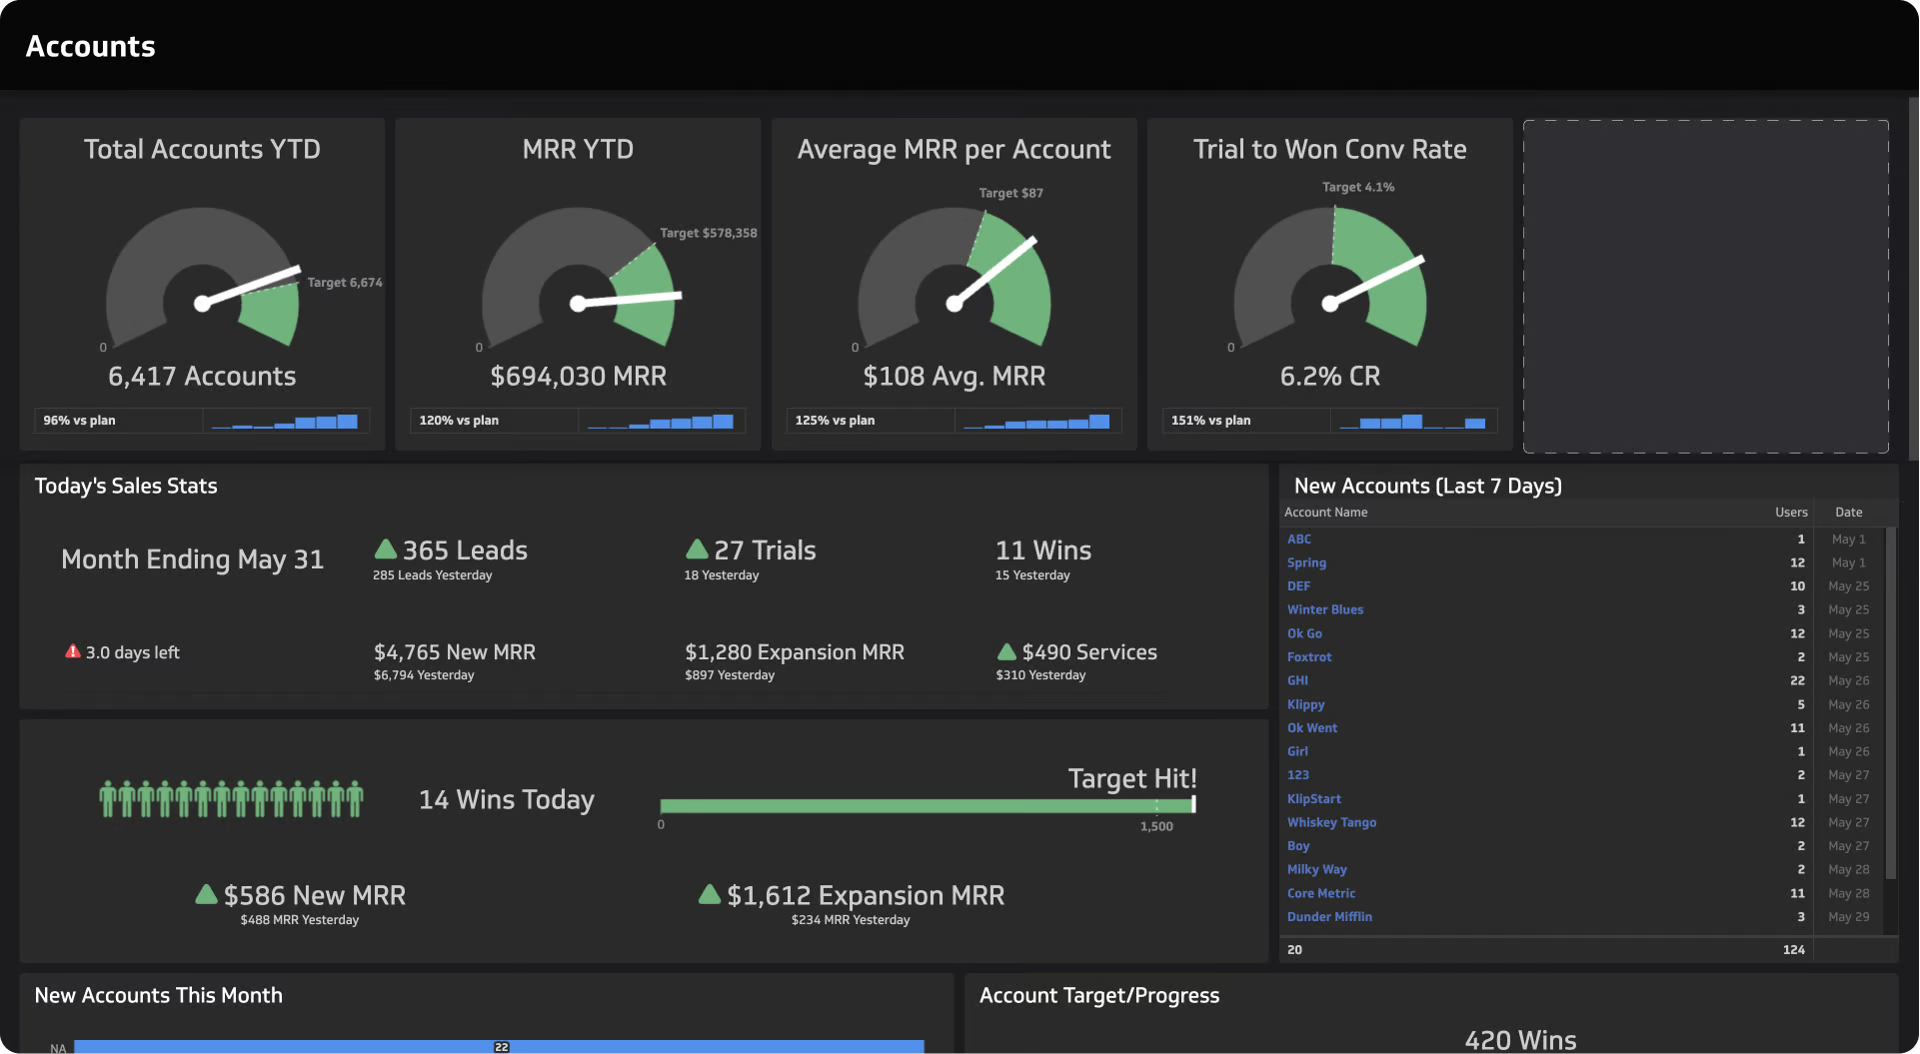
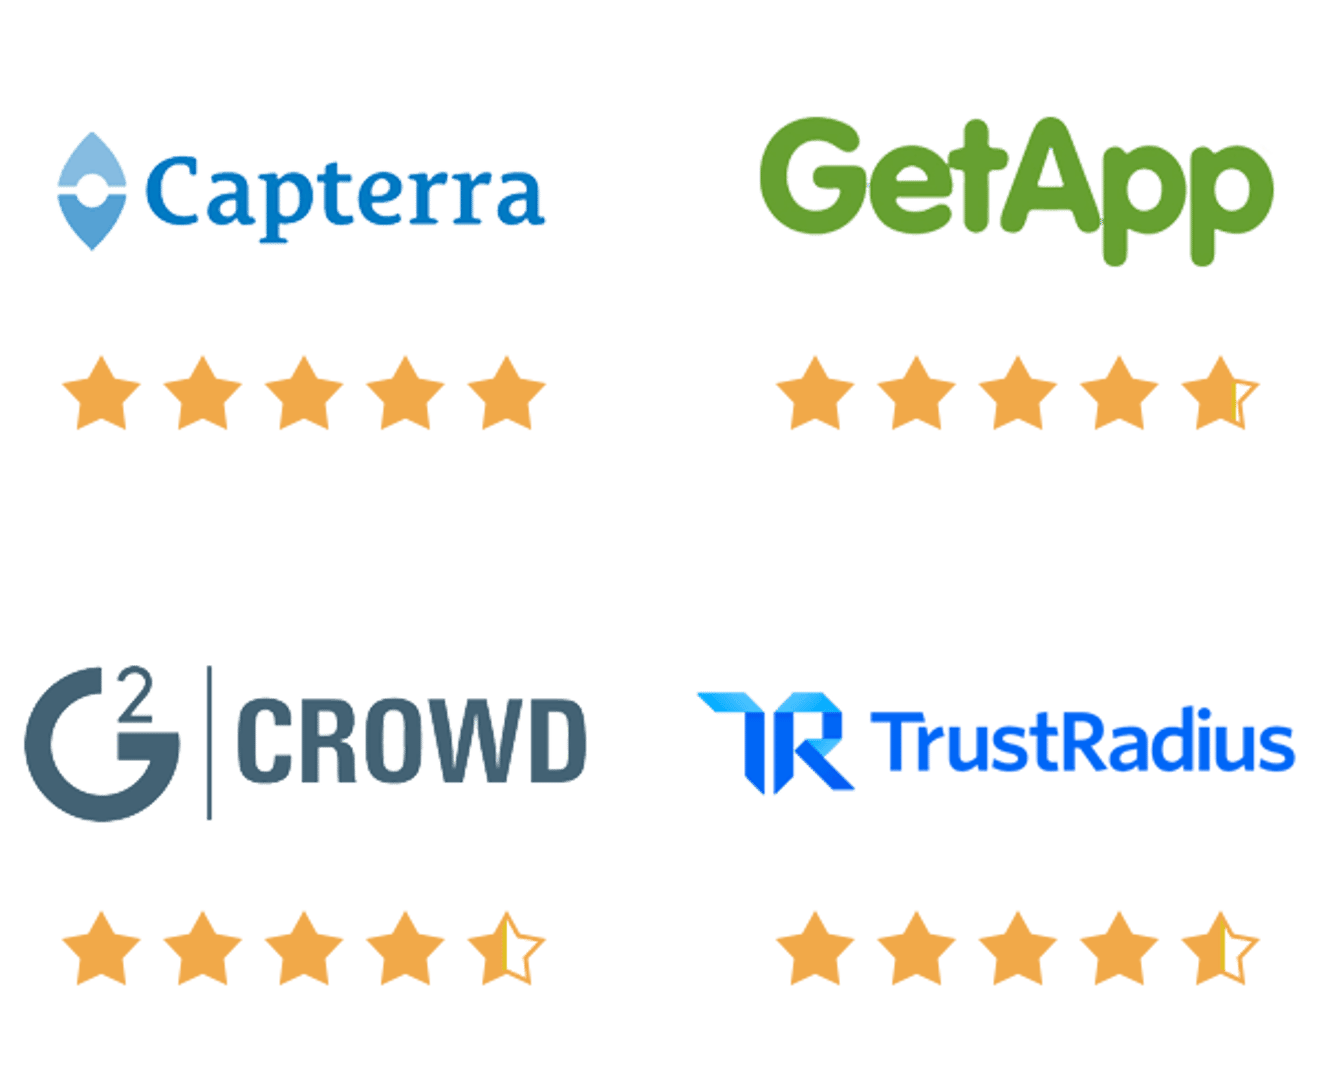
Offer your clients the industry’s highest-rated agency reporting solution
By partnering with Klipfolio, you can start giving your customers access to the world’s best dashboard platform without breaking a sweat (or the bank).

Everything in one place
With over 130 data service integrations, you can count on Klips to get your clients’ data into dashboards. Pull in data that’s stored on premise or in the cloud, upload spreadsheets, write custom SQL queries, or email data automatically from 3rd-party services. Excel-like formulas and functions help you transform your data, perform calculations, add logic and client-level personalization. Real-time, raw data will update your clients’ dashboards right in front of their eyes.
Get started with Klips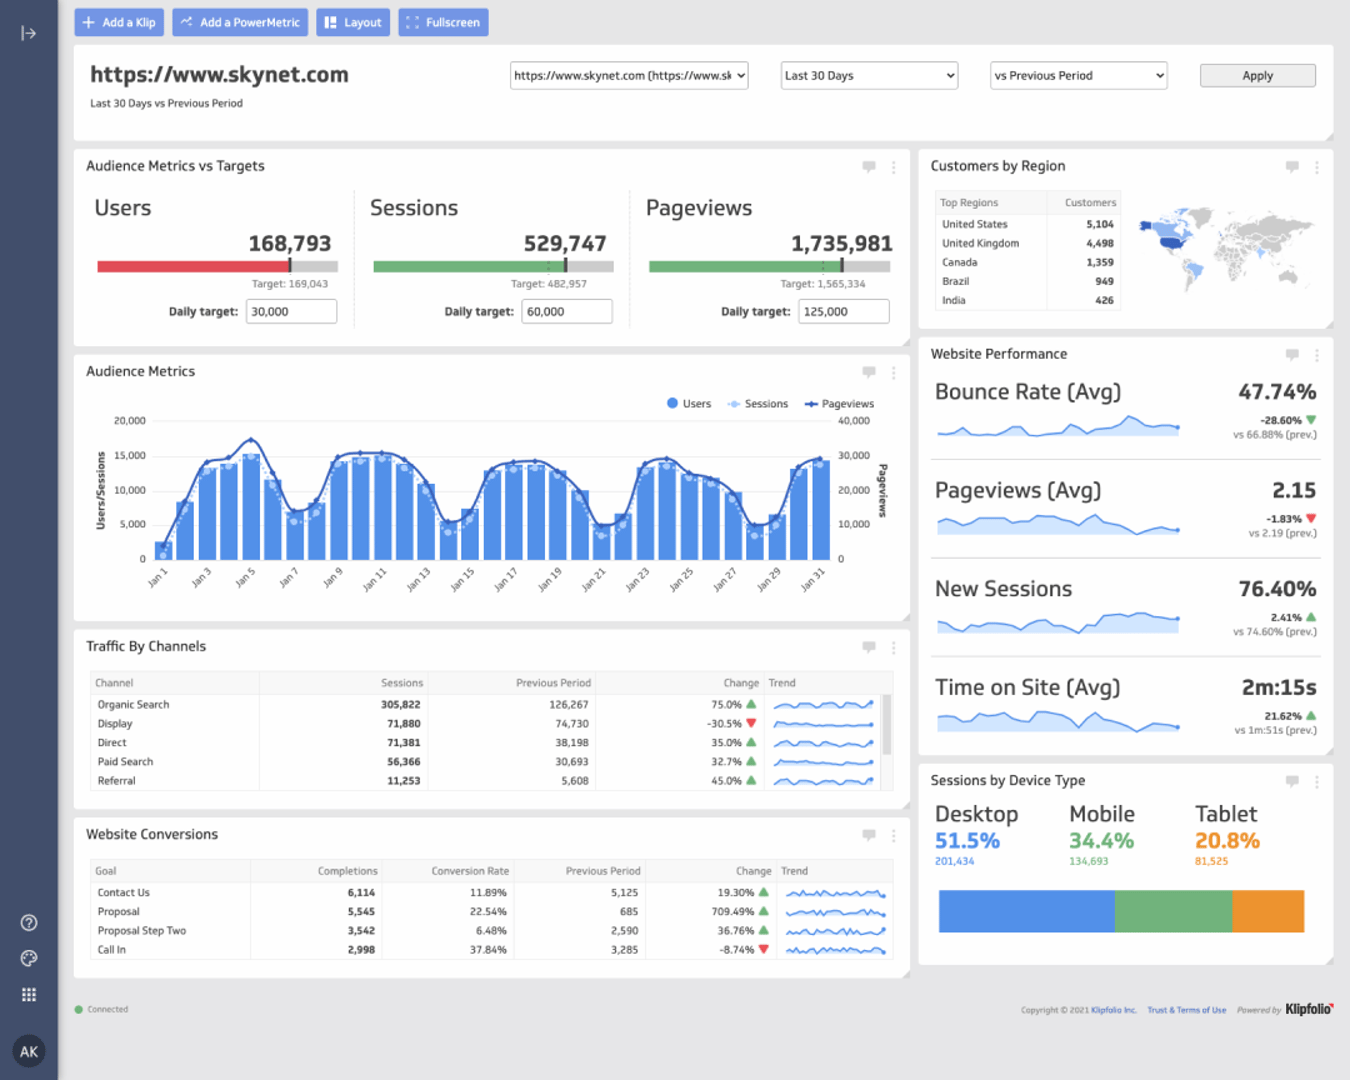
Highly customizable
dashboards and visualizations
Every client has different needs. Klips allows you to build virtually any visualization you want and control the look and feel of your dashboards with custom themes. Modify visualization properties in the Klip Editor or dig in and build powerful, one-of-a-kind visualizations using the HTML template component, with JavaScript and inline CSS.
Get started with Klips
Serve more clients and scale fast
Your time is valuable. Skip the manual effort involved in serving multiple clients. Instead, use templates and advanced reporting automation to save hundreds of hours. Build dashboard templates once and copy them into individual customer accounts. With the Klips report engine, you can set up scheduled email snapshots or reports. Say goodbye to manual effort and hello to automation!
Get started with KlipsBeyond Dashboards
Klips Features
Client Management
Whether you manage a few client accounts, or hundreds, Klipfolio’s Client Management platform will scale with your business.

Manage multiple accounts
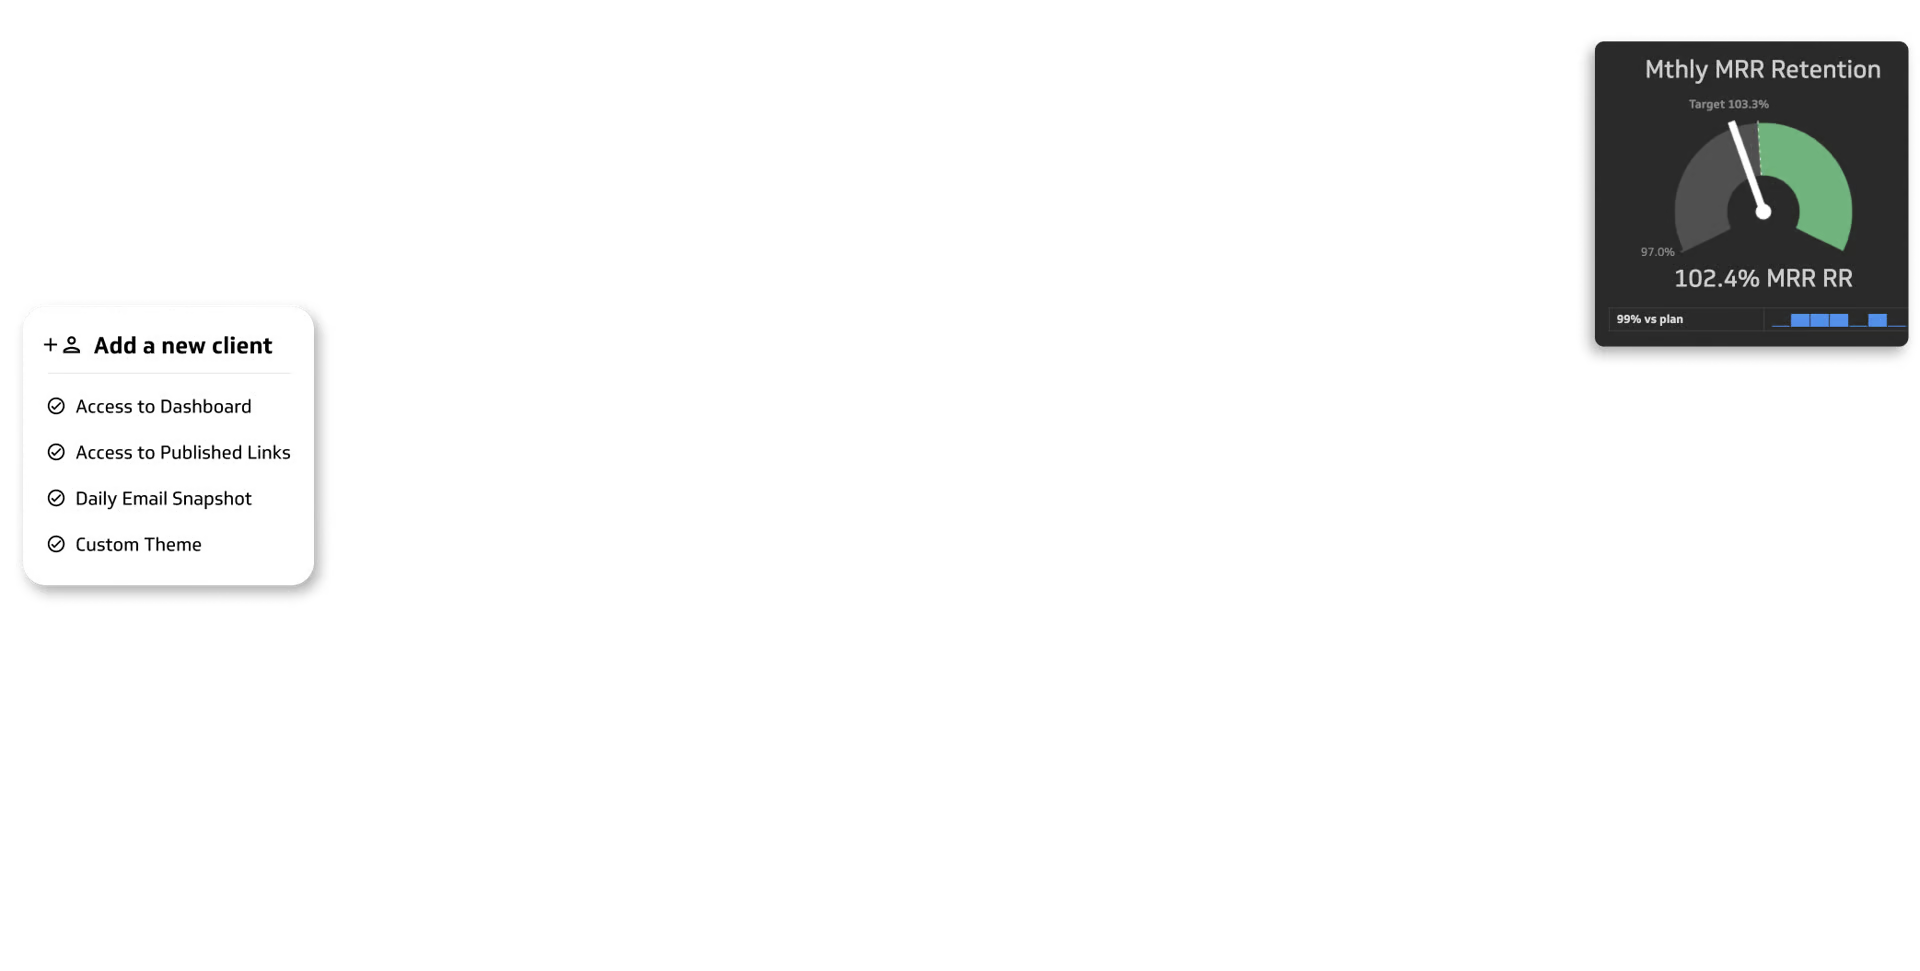
Create and manage hundreds of new clients from your partner account with the click of a button.

Standard or unique, you choose
Import data visualizations and sources. Create dynamic dashboards that are standard or exclusive to each client with the admin sign-in option.

Free accounts for your clients
Show your clients the value of dashboards before they commit with free trial accounts.

Customized billing options
Bill your clients yourself or choose to save time and effort with Klipfolio’s managed client billing.
Customization and Automation
Enjoy the freedom and flexibility of customization. Start with templates for your typical clients or create unique content when needed..

Personalize your dashboard
Clone dashboard templates to avoid starting from scratch. Take customization to a new level by creating unique, personalized themes with CSS and Javascript.

White-labelling
Our white-labelling feature gives you the opportunity to replace Klipfolio branding with your own. Change key application terminology, colours, logos and more.

Domain aliasing
Don’t want your clients logging into their dashboards at app.klipfolio.com? No problem. Domain aliasing allows you to direct your clients to a domain you specify to log in.

Automated processes
With a little API work and some script writing, you can streamline and automate adding users, sharing content, and creating data sources.
Sharing and Publishing
Whether you want to give your client on-demand access to the dashboards you create, or automate dashboard reporting, or send out a client report on an ad hoc basis, Klips has an option that will make sharing with clients easy.

User access controls
As the administrator of a client account, you can grant access to the account, setting different rights and privileges for each user.

Published Links
Share dashboards with clients using Published Links, which are URLs that can be shared with or without a password.
Email reports
Schedule regular email snapshots of individual data visualizations or entire dashboards to be sent to specific people, at specific times.

Embedding
Seamlessly and easily embed data visualizations into HTML pages or host applications.
See what our customers are saying about Klips

I build dashboards for clients across many industries and it is by far the best tool I’ve come across for building KPI reports that are used daily and motivate teams to make progress on business goals.

Andrew W.
Director at IT MOOTI
I like how much you can customize the look and feel of your dashboard. Klipfolio connects all of our disparate systems within our HR department. Seeing survey, HRIS, and ATS data in one dashboard is really cool.

Carolyn S.
People Insights Manager at formstack.com
We upload daily data about our business and it’s really helpful to get insights and monitor revenue in real-time.

Sebastián P.
CPO at E-Planning.net