Excel
Create, collaborate, edit, and organize your data with Excel spreadsheets. Input formulas, tabulate values, and more with Excel's leading platform.
Track all your Excel KPIs in one place
Sign up for free and start making decisions for your business with confidence.
Excel Dashboarding
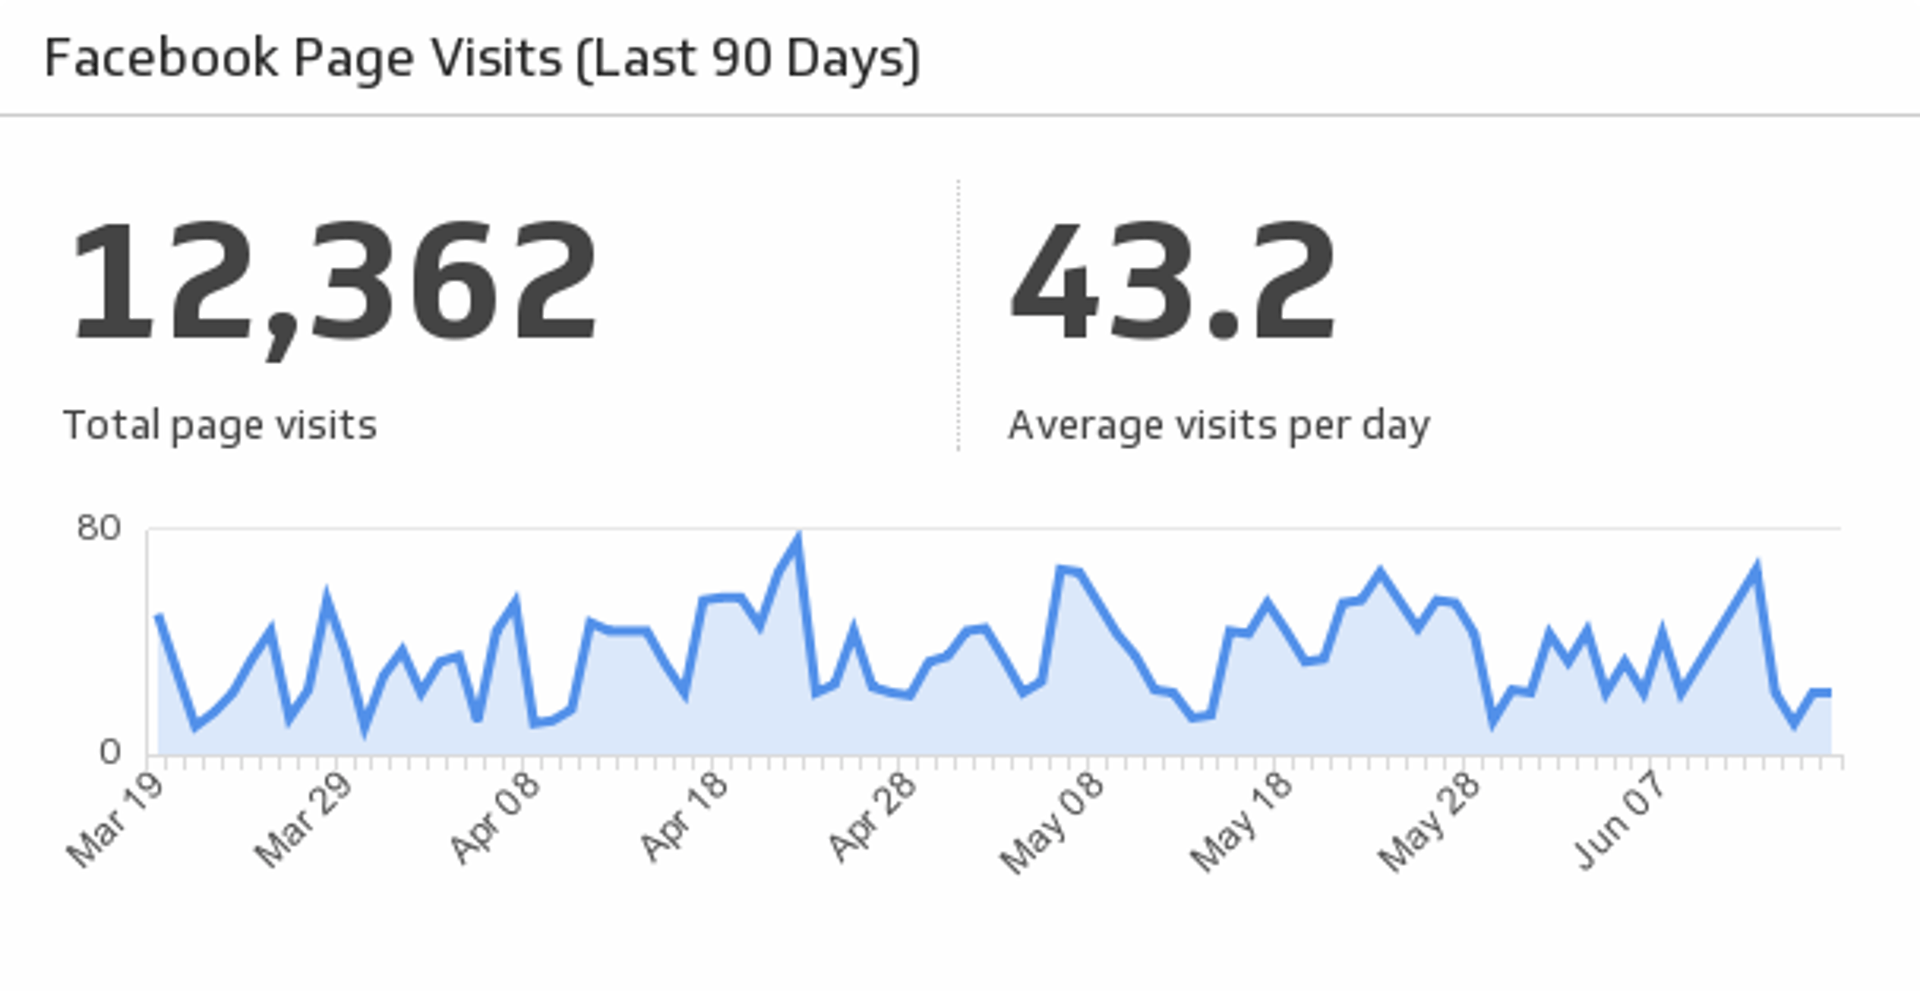
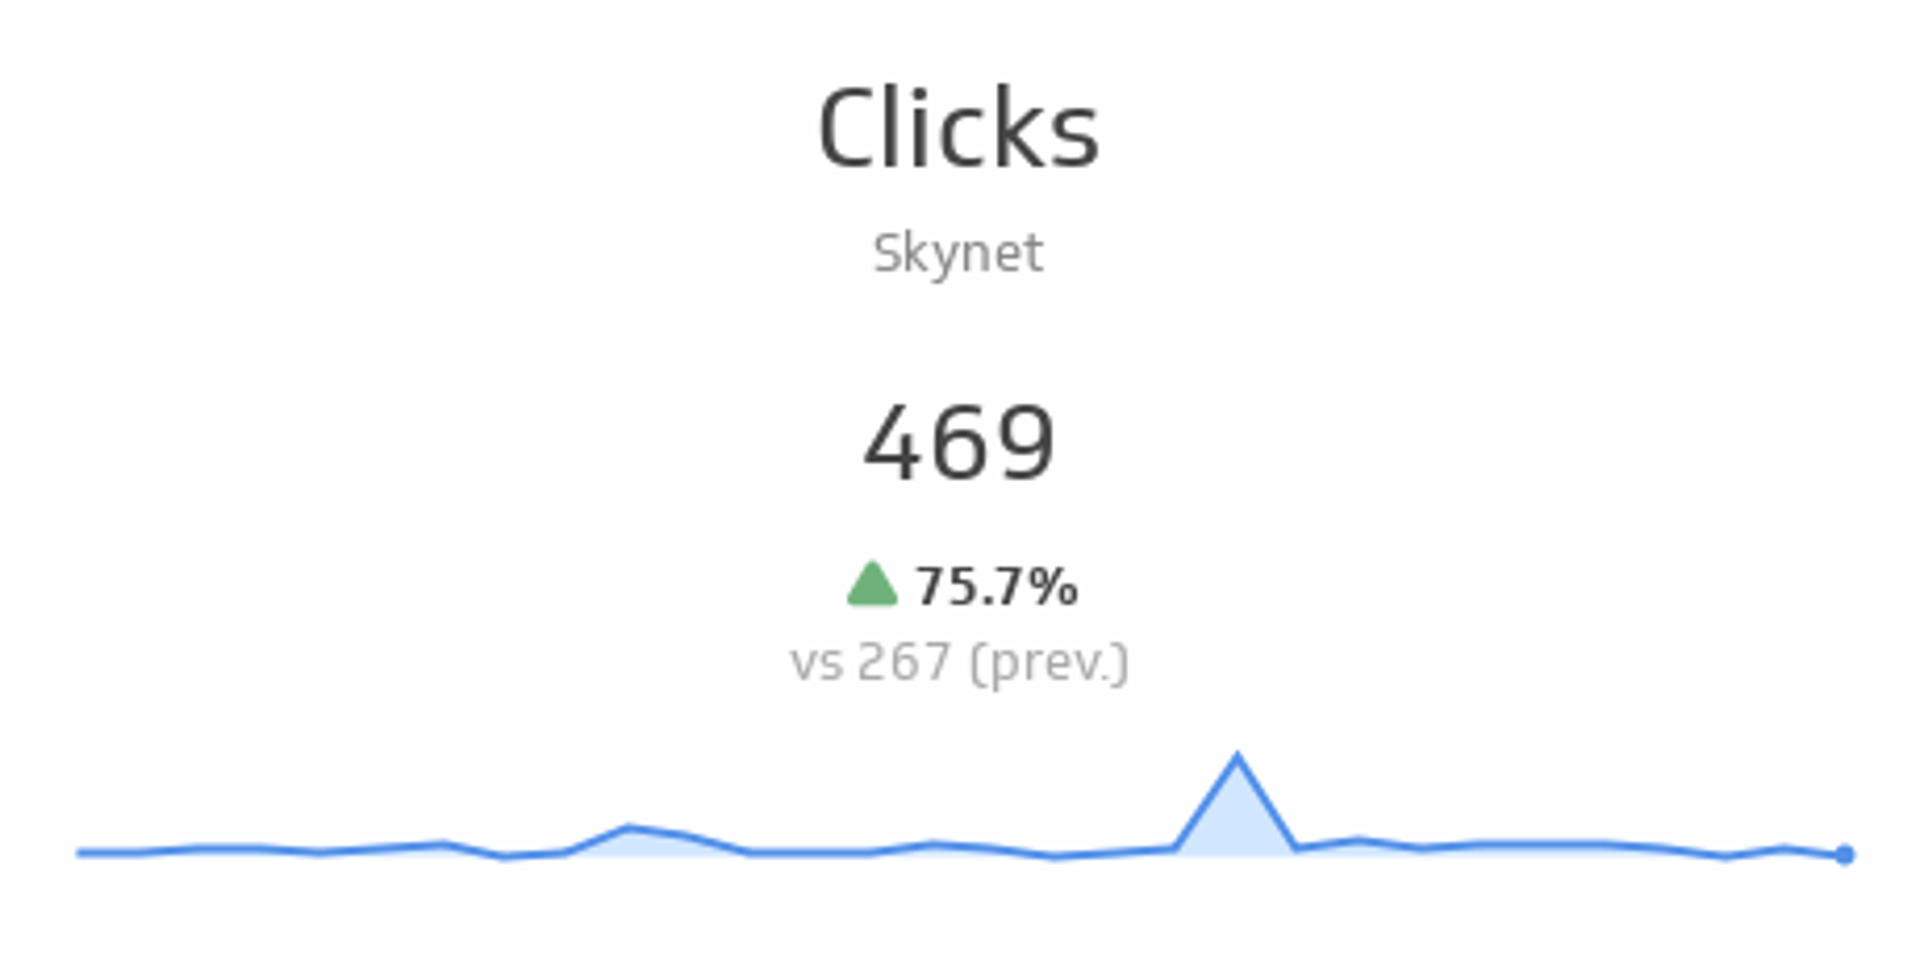
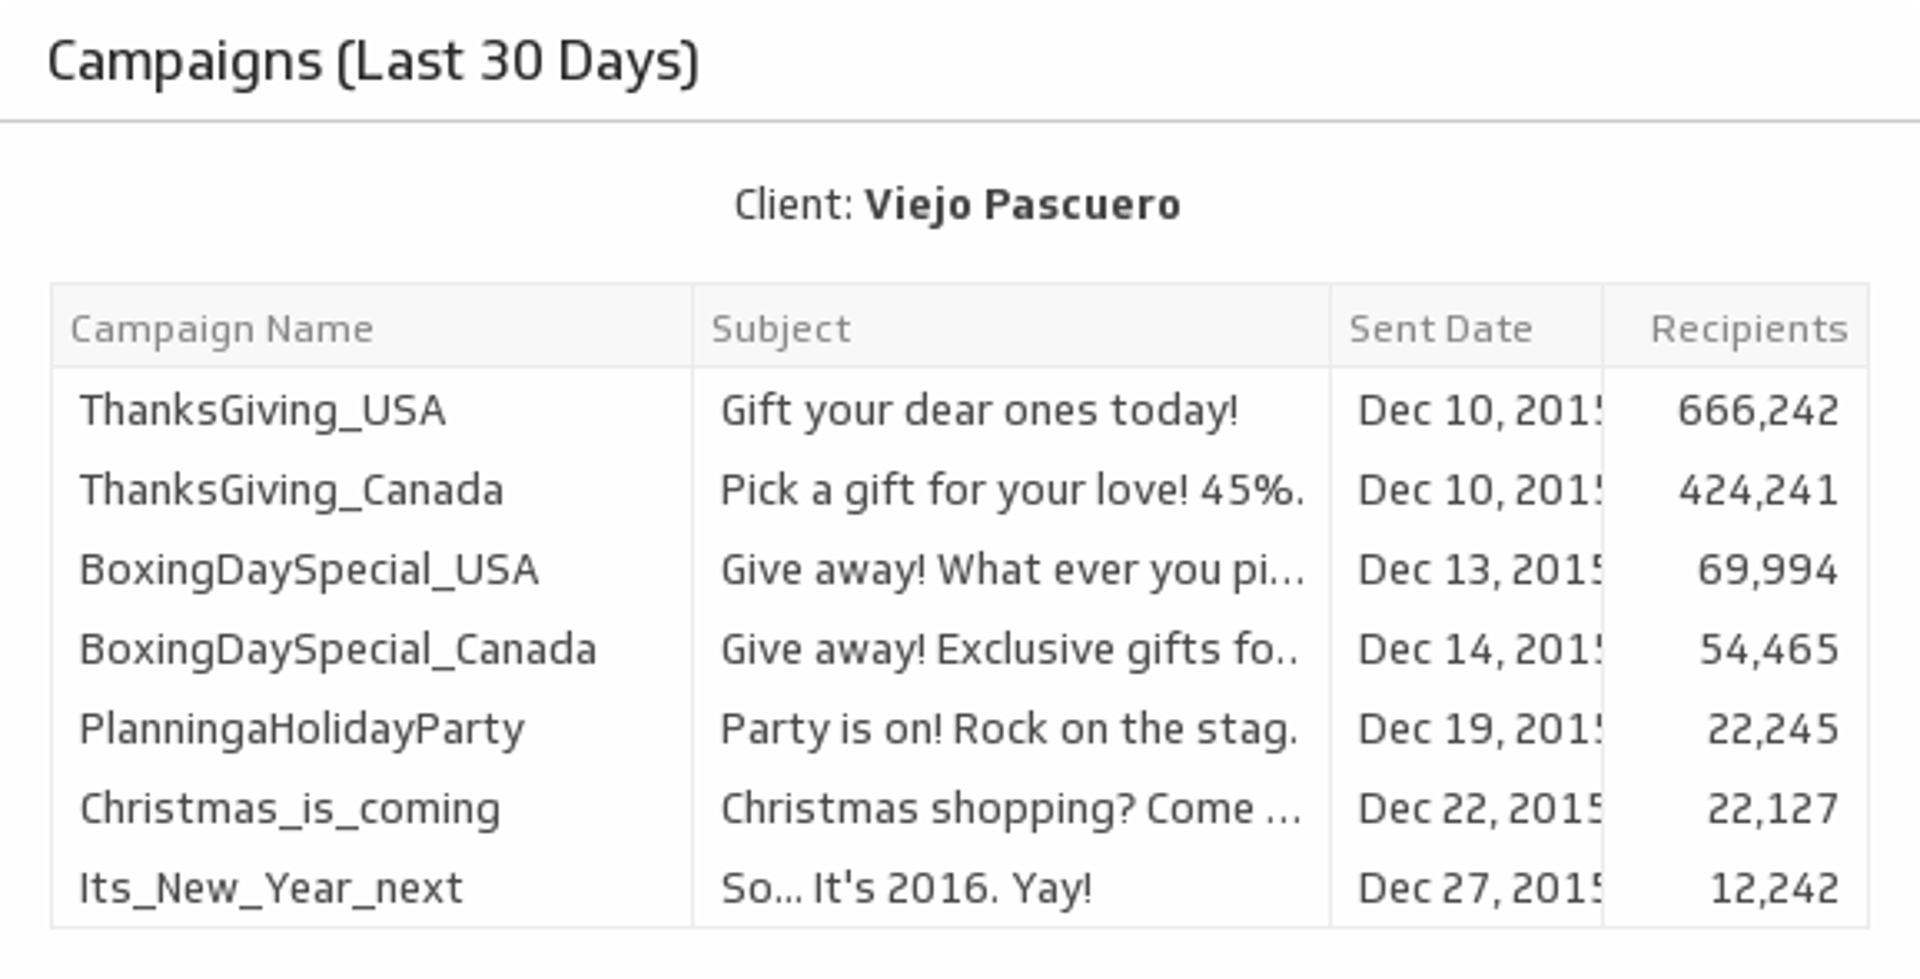
Create dashboards and data visualizations using your Excel spreadsheets. Klipfolio lets you build custom dashboards using all of your data. Combine Excel data with metrics from web services, SQL databases, and custom data sources.
How to build an Excel dashboard?
- Follow our guide.
- Connect your data. Upload your Excel spreadsheet to Klipfolio with built-in integration.
- Select your metrics. Figure out what’s important for you and your team to track.
- Design your dashboard. Customize your visualizations, change colors, and add some indicators.
Upload your Excel spreadsheets
Easily upload your Excel spreadsheets to Klipfolio to start building dashboards. You can upload files directly or use file sharing services like DropBox and Google Drive to automate data source upload.
Beautiful Excel TV dashboards
Promote a data driven culture by displaying your Excel dashboards on TVs throughout your office. Stop sending email attachments that never get opened and start showing your team the data used to grow your business.
Create custom data visualizations
Use the Klip Editor to design and build custom visualizations using your Excel spreadsheets.
Why use Klipfolio and Excel?
Klipfolio's dashboarding capabilities are the perfect complement to Excel's analysis and reporting functionality. Here are a few reasons why Klipfolio works so well with Excel.
- Version control
- Auto update data
- Engaging visualizations
- Broad customization options
- Easily connect Excel to 400+ data services
With Klipfolio, learn how to navigate Excel the way you know best, without finding yourself in a sea of overwhelming functions.
Use pre-built Excel metrics
Assemble a Excel dashboard by selecting pre-built metrics from the Klip Gallery.
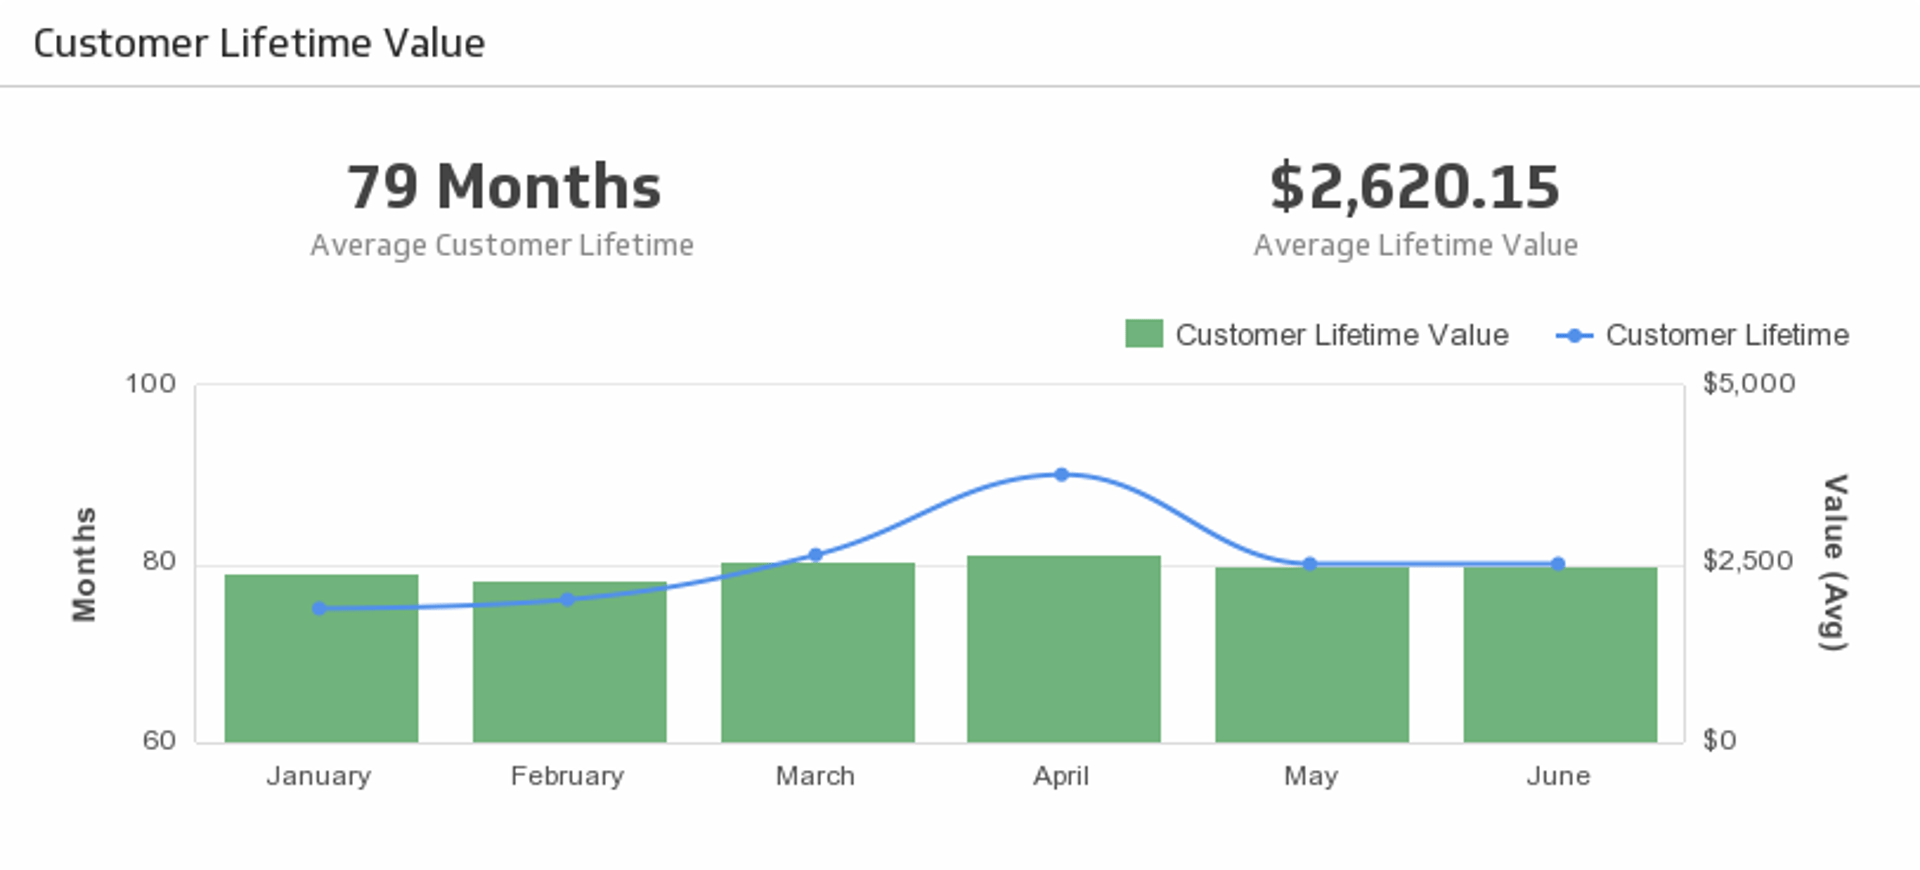
Customer Lifetime Value
The longer customers stick with you, the more valuable they are. Monitor Customer Lifetime Value, and at the same time, compare with the historical trend.

Sample: Lead Funnel
Measure the volume throughout each stage of your funnel, and focus in on the stages that matter most to you to improve your processes.

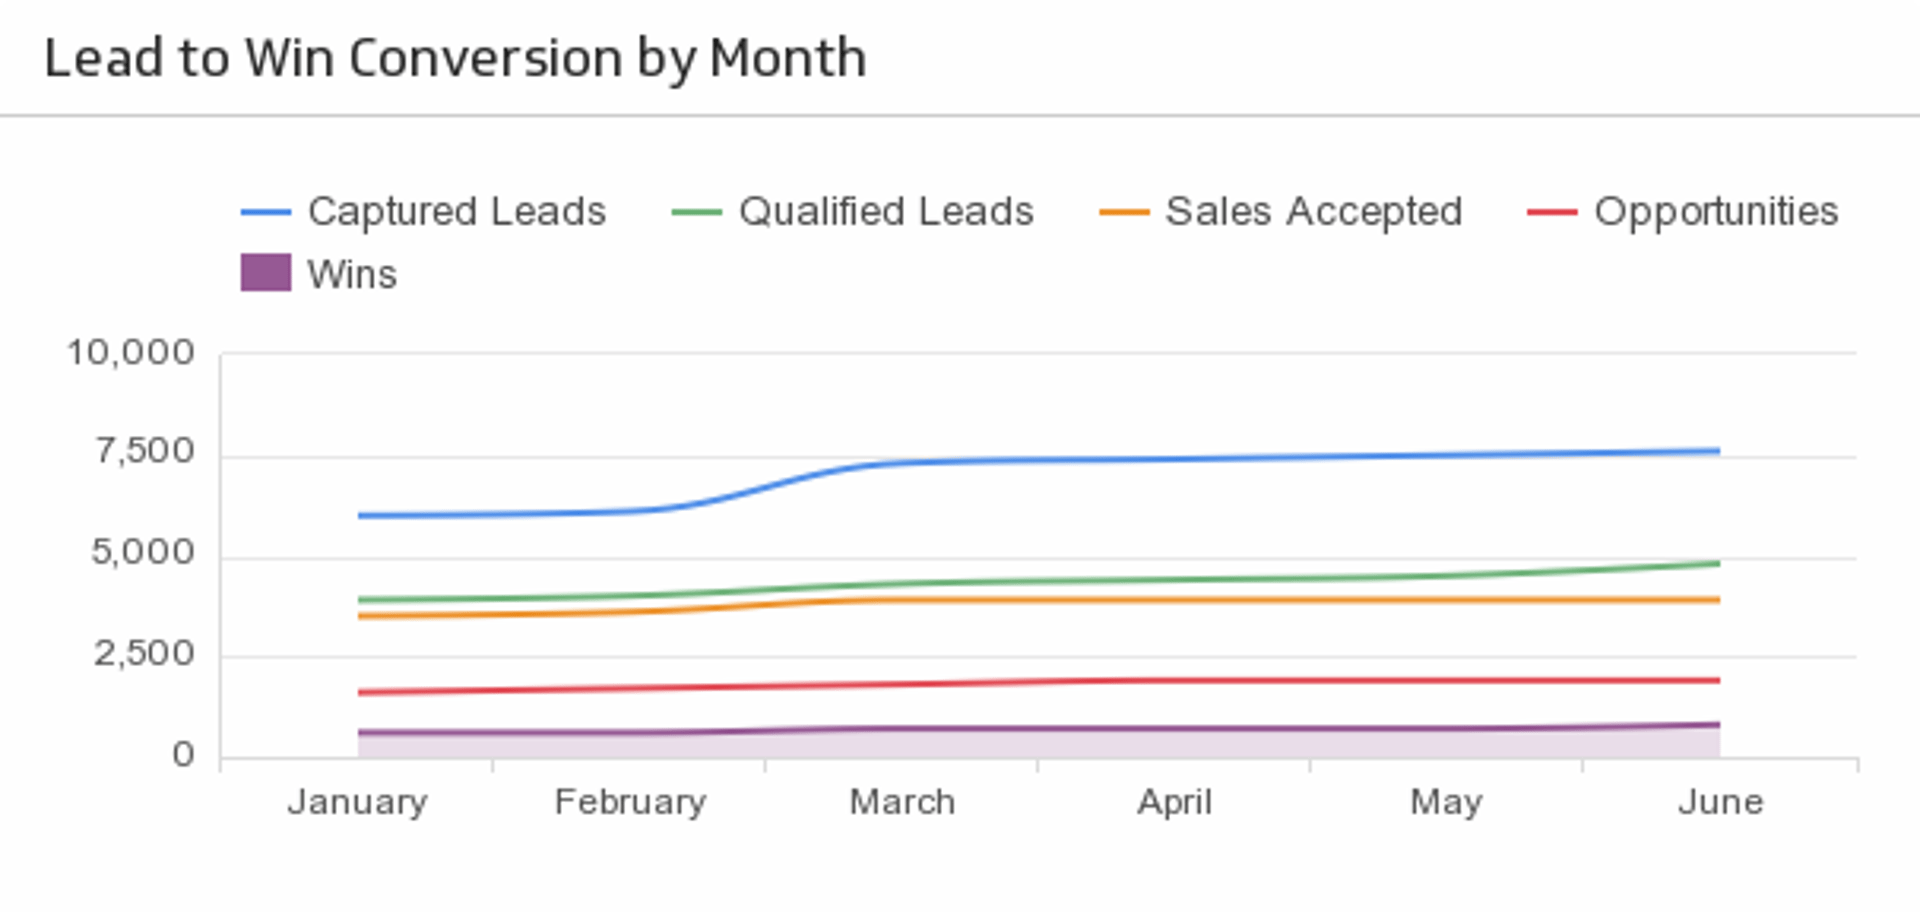
Sample: Lead to Win Conversion
Use a line chart to track your lead to win conversion rate over time.
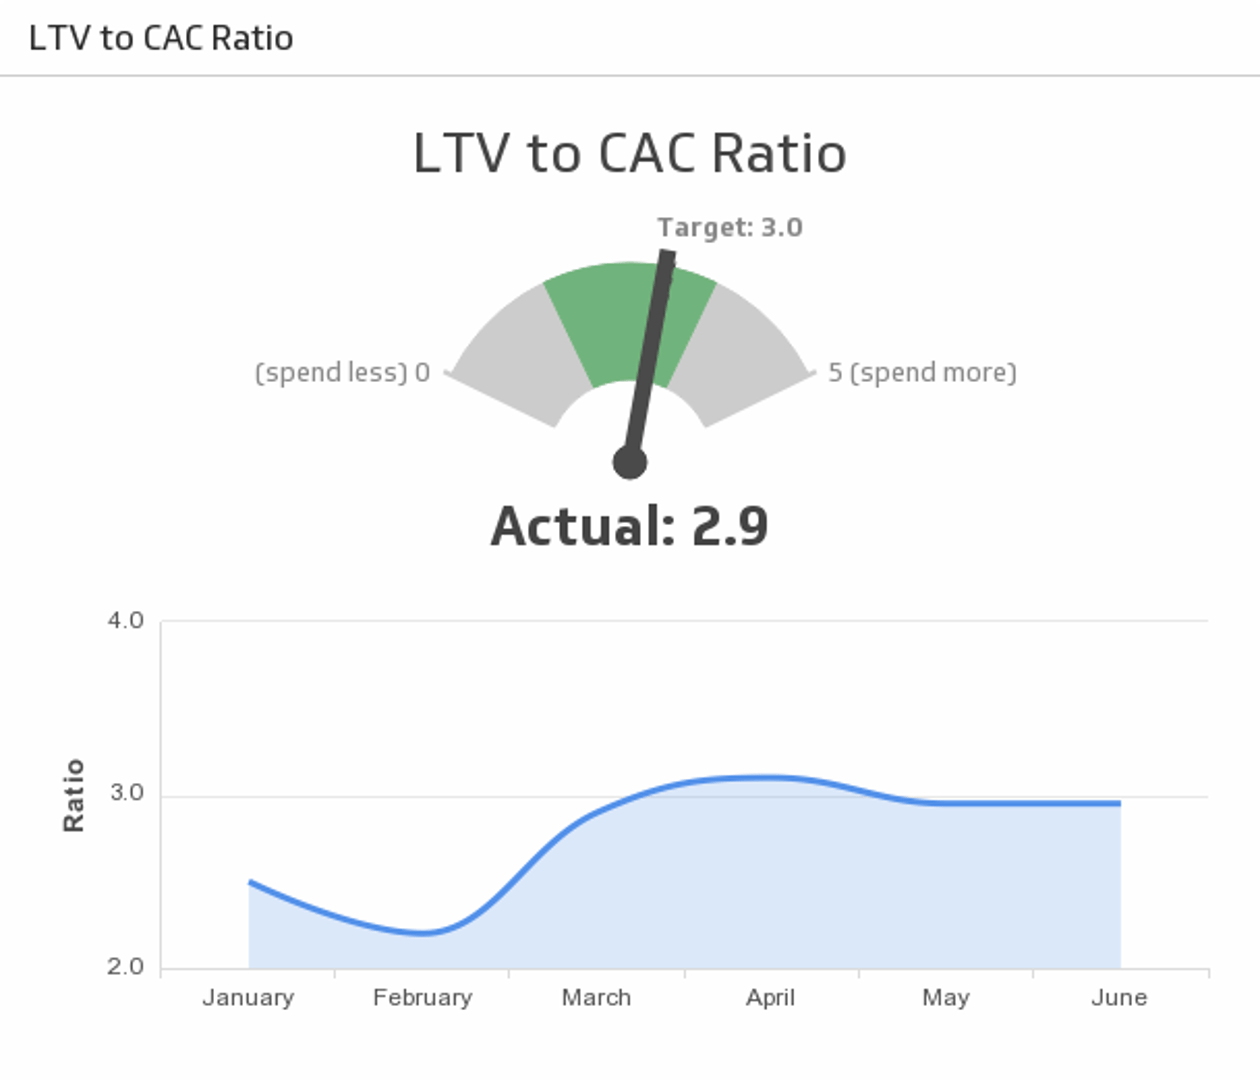
Sample: LTV to CAC Ratio
Ensure your marketing spend is optimized. Track the ratio between the lifetime value of a customer and the cost of acquiring that customer (LTV to CAC) against the historical trend.
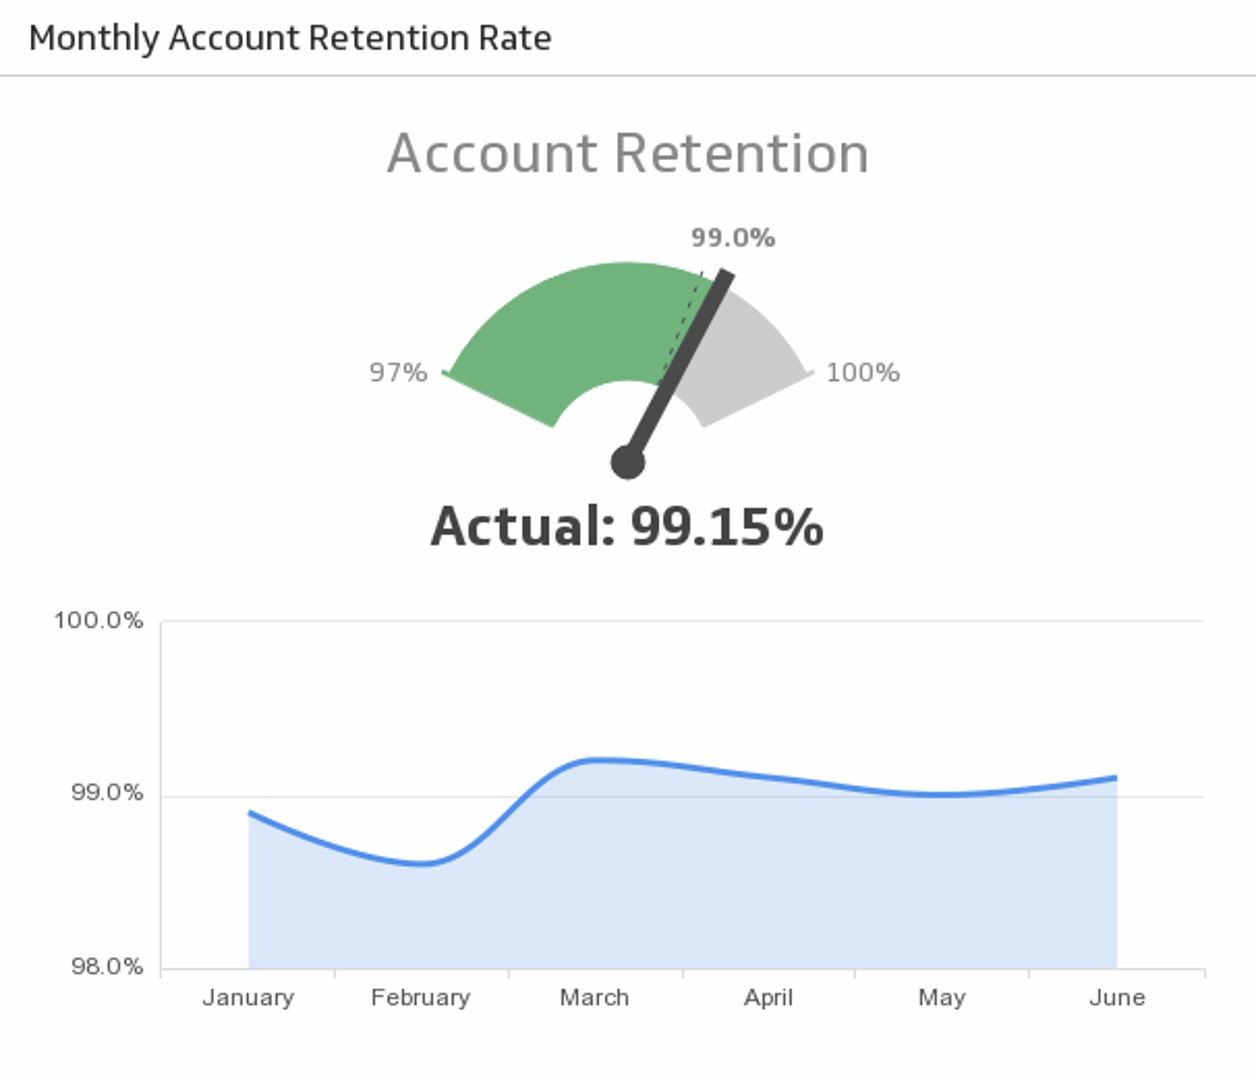
Sample: Monthly Account Retention Rate
Reach your Monthly Account Retention Rate target and compare it to the trend.
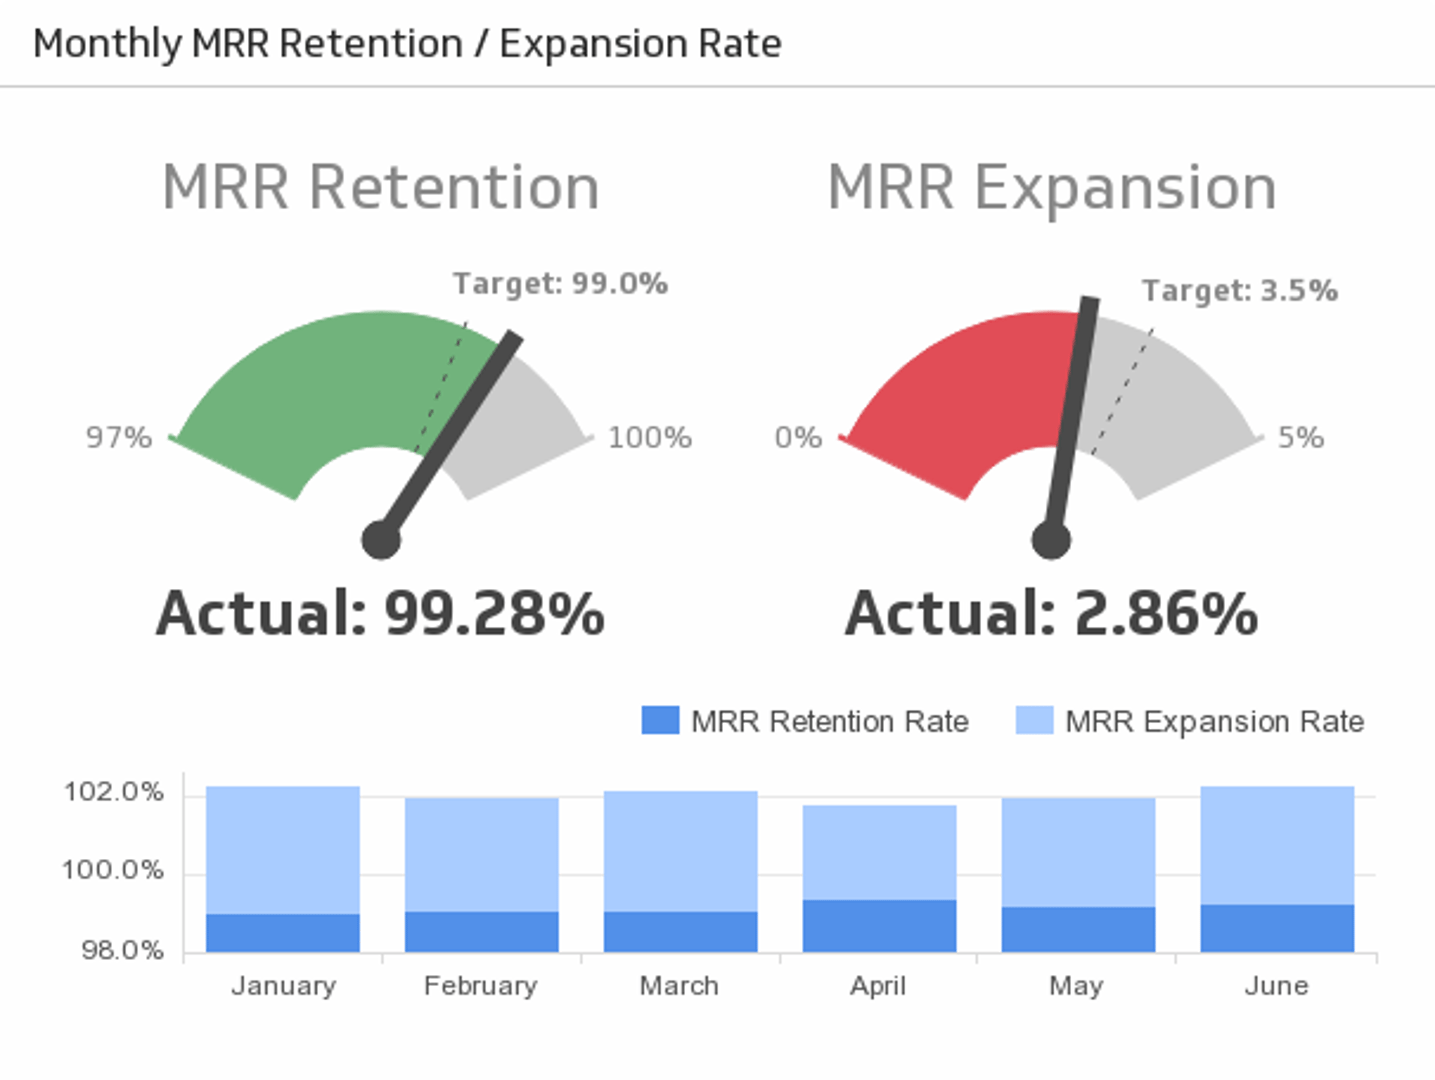
Sample: MRR Retention / Expansion Rate
Monthly Recurring Revenue (MRR) is a central facet to many businesses. Track how effective your organization is at retaining and growing expected monthly revenue.
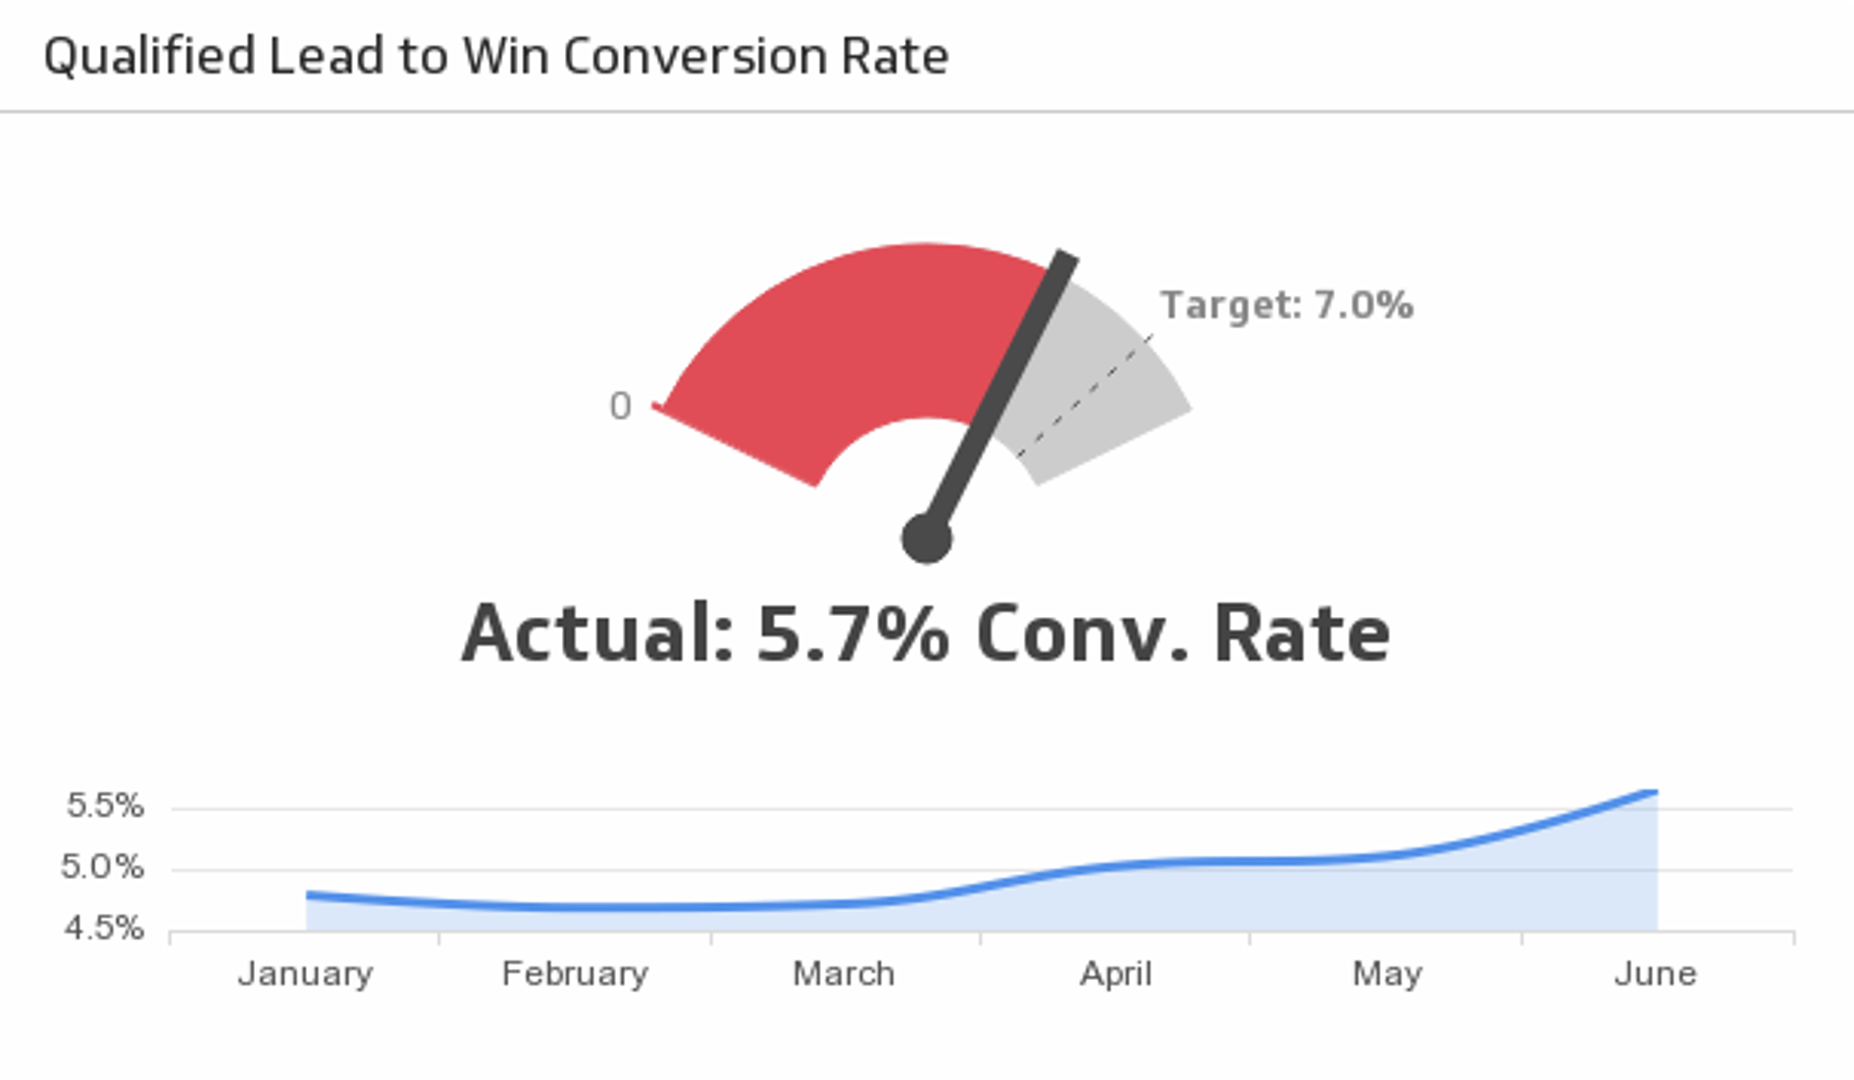
Sample: Qualified Lead to Win Conversion Rate
Reach your lead to win conversion rate target and compare it to the trend.
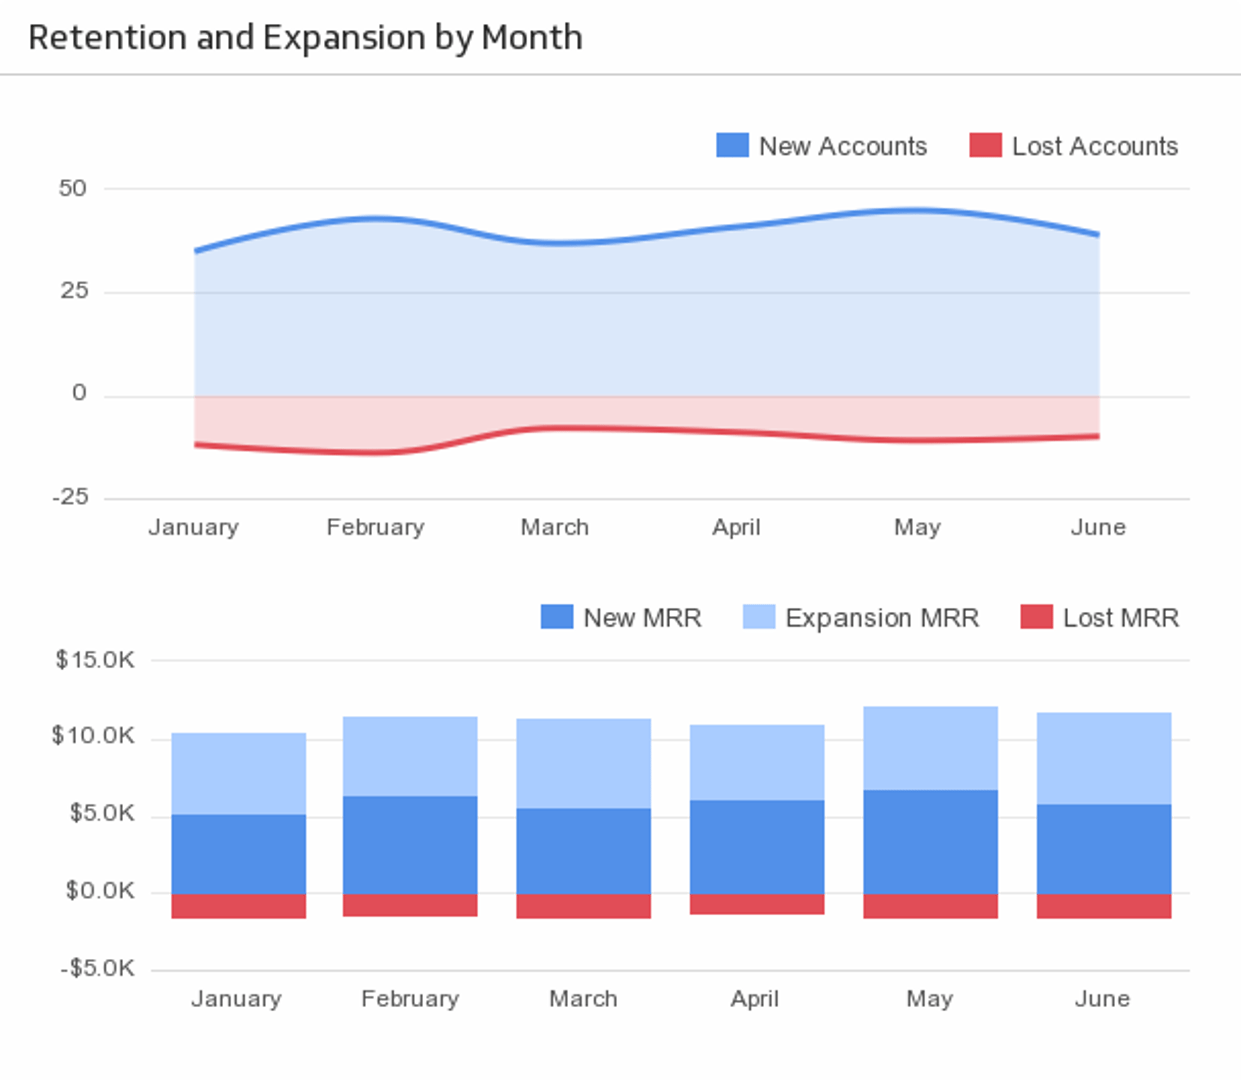
Sample: Retention and Expansion by Month
Monitor business retention and expansion on a month-to-month basis, and keep the pulse of your business in check.
Use the Connector Gallery to create a custom Excel dashboard
With our Connector Gallery, you can create custom API queries to pull in data from your Excel account. Building custom queries allows you to specify the metrics and time periods that you want to track.
You can use custom queries to build out visualizations in Klipfolio. You can also combine your Excel data with other relevant data to create your custom dashboard.
Learn more about working with the Excel API and how you can start building your own Excel queries in Klipfolio.

.svg)