Amazon Redshift
Amazon Redshift is a fully managed, petabyte-scale data warehouse service in the cloud.
Track all your Amazon Redshift KPIs in one place
Sign up for free and start making decisions for your business with confidence.
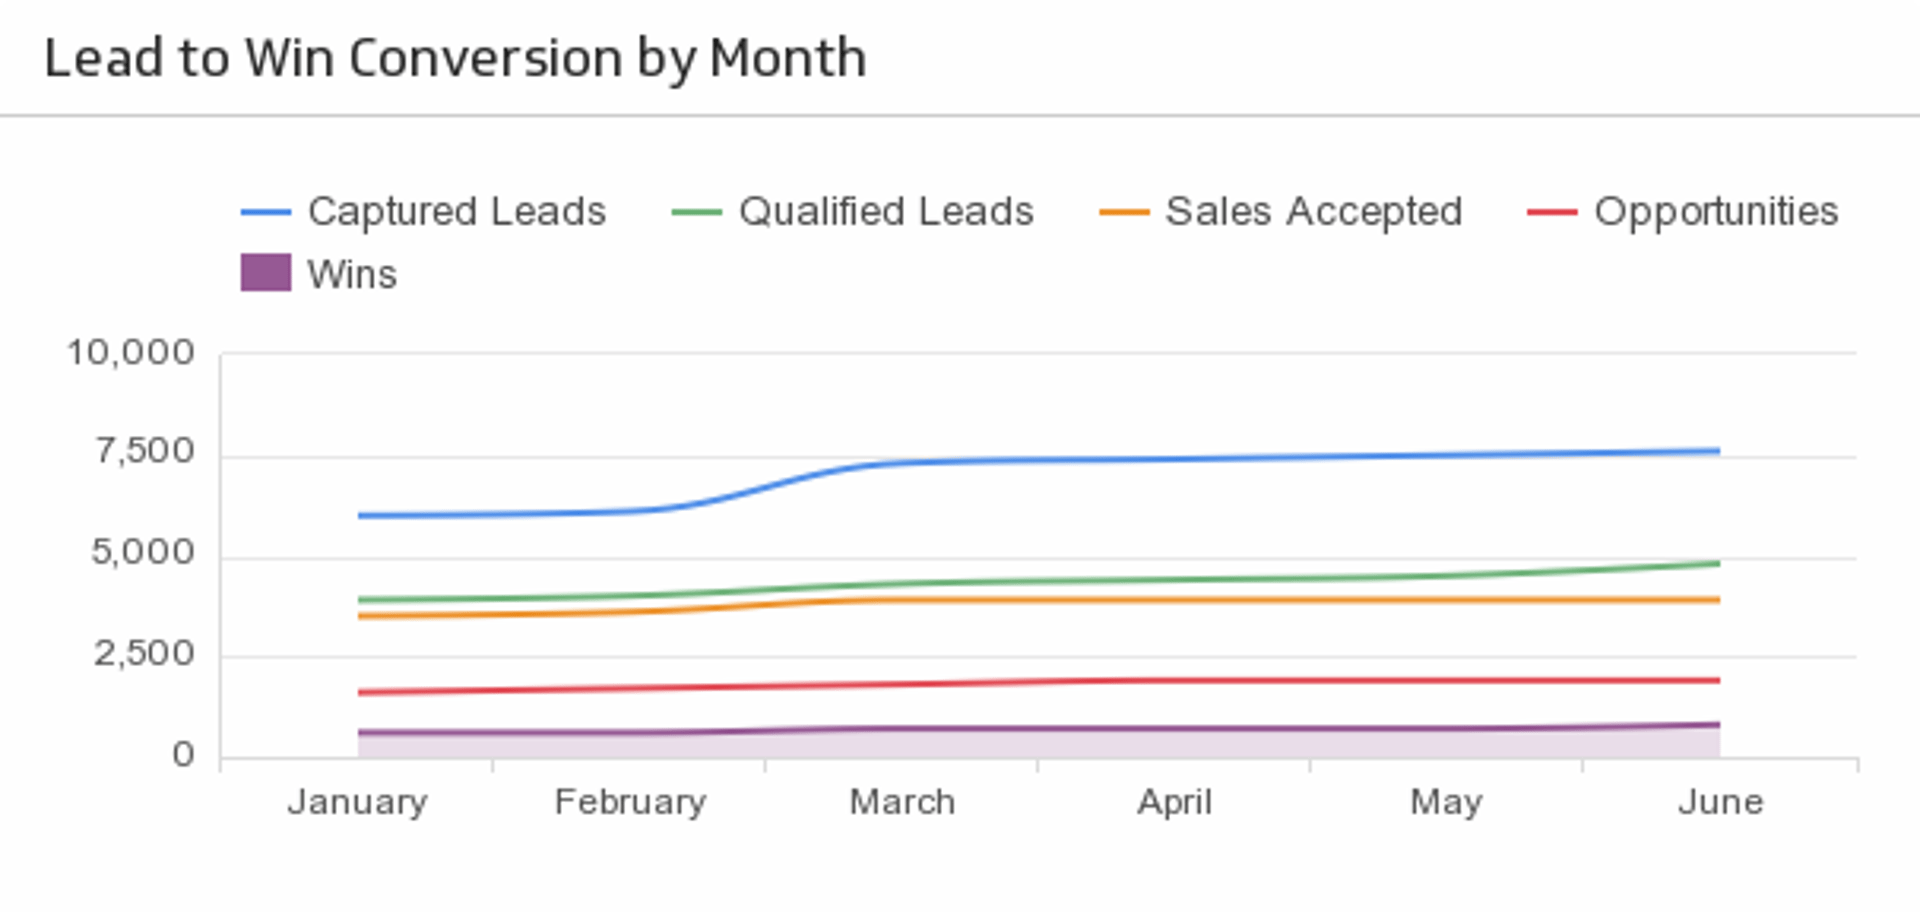
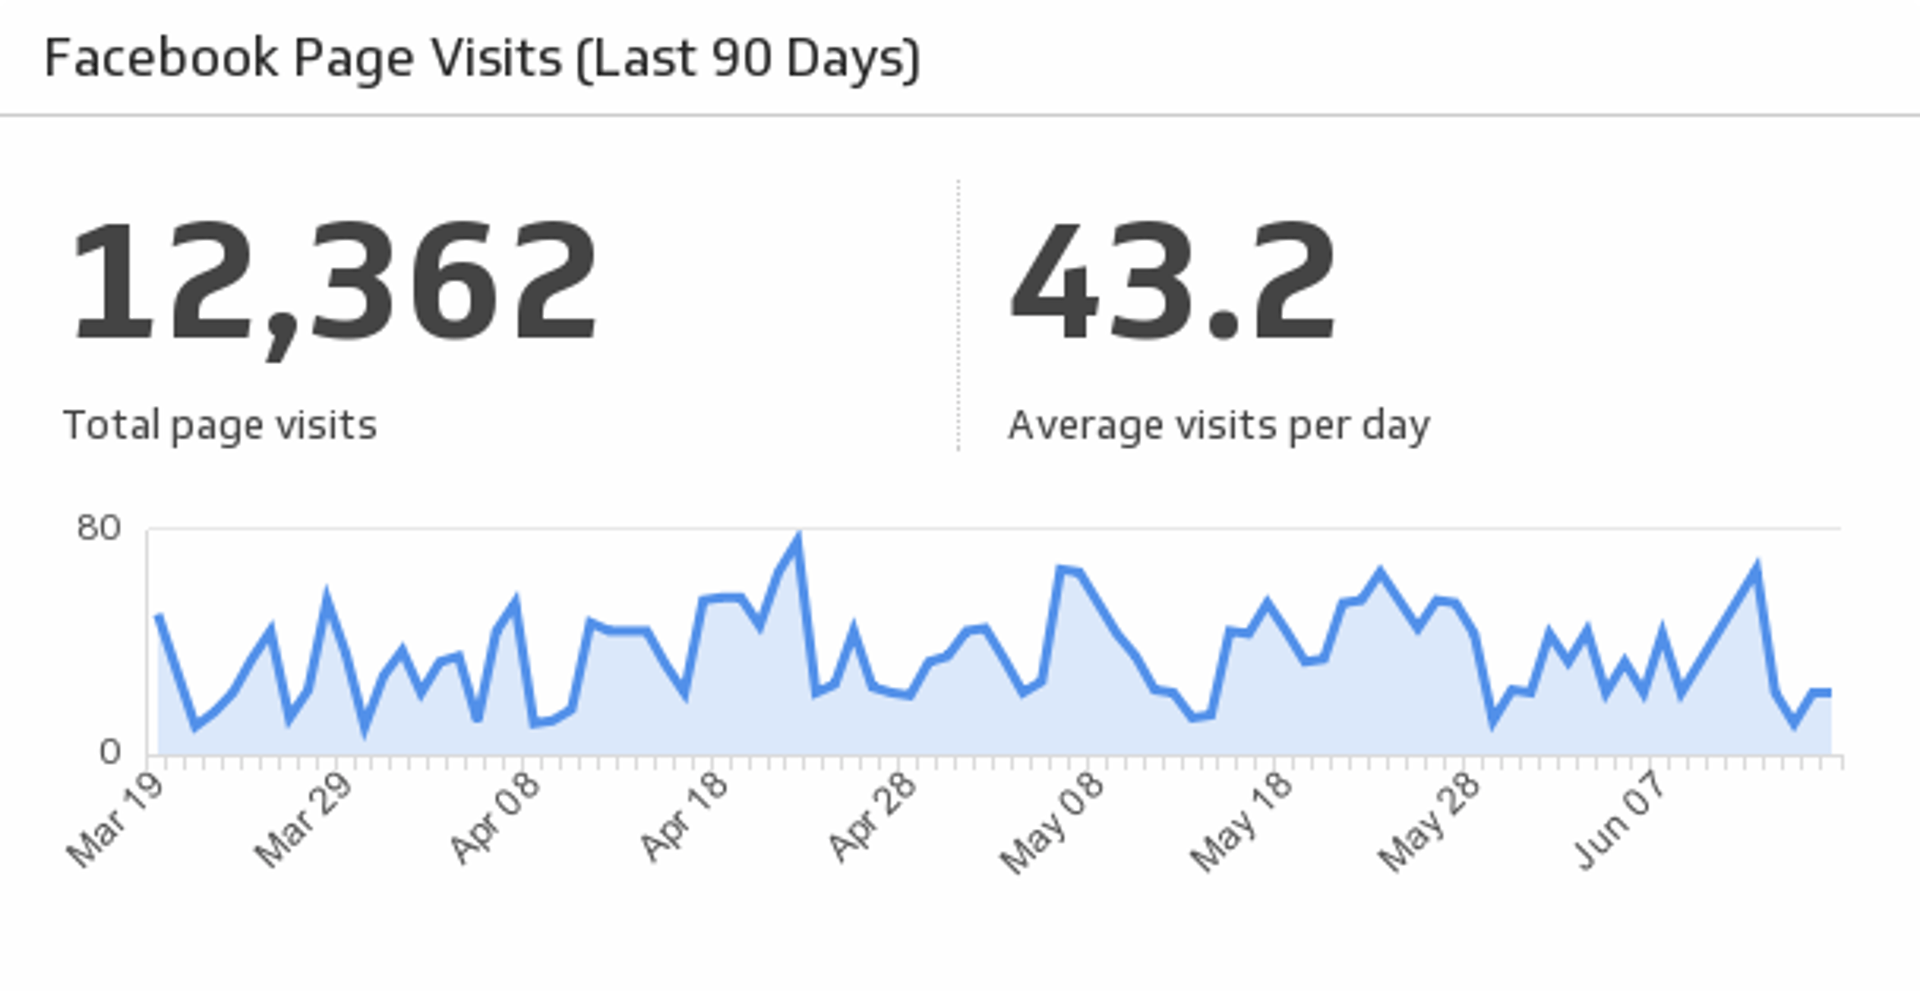
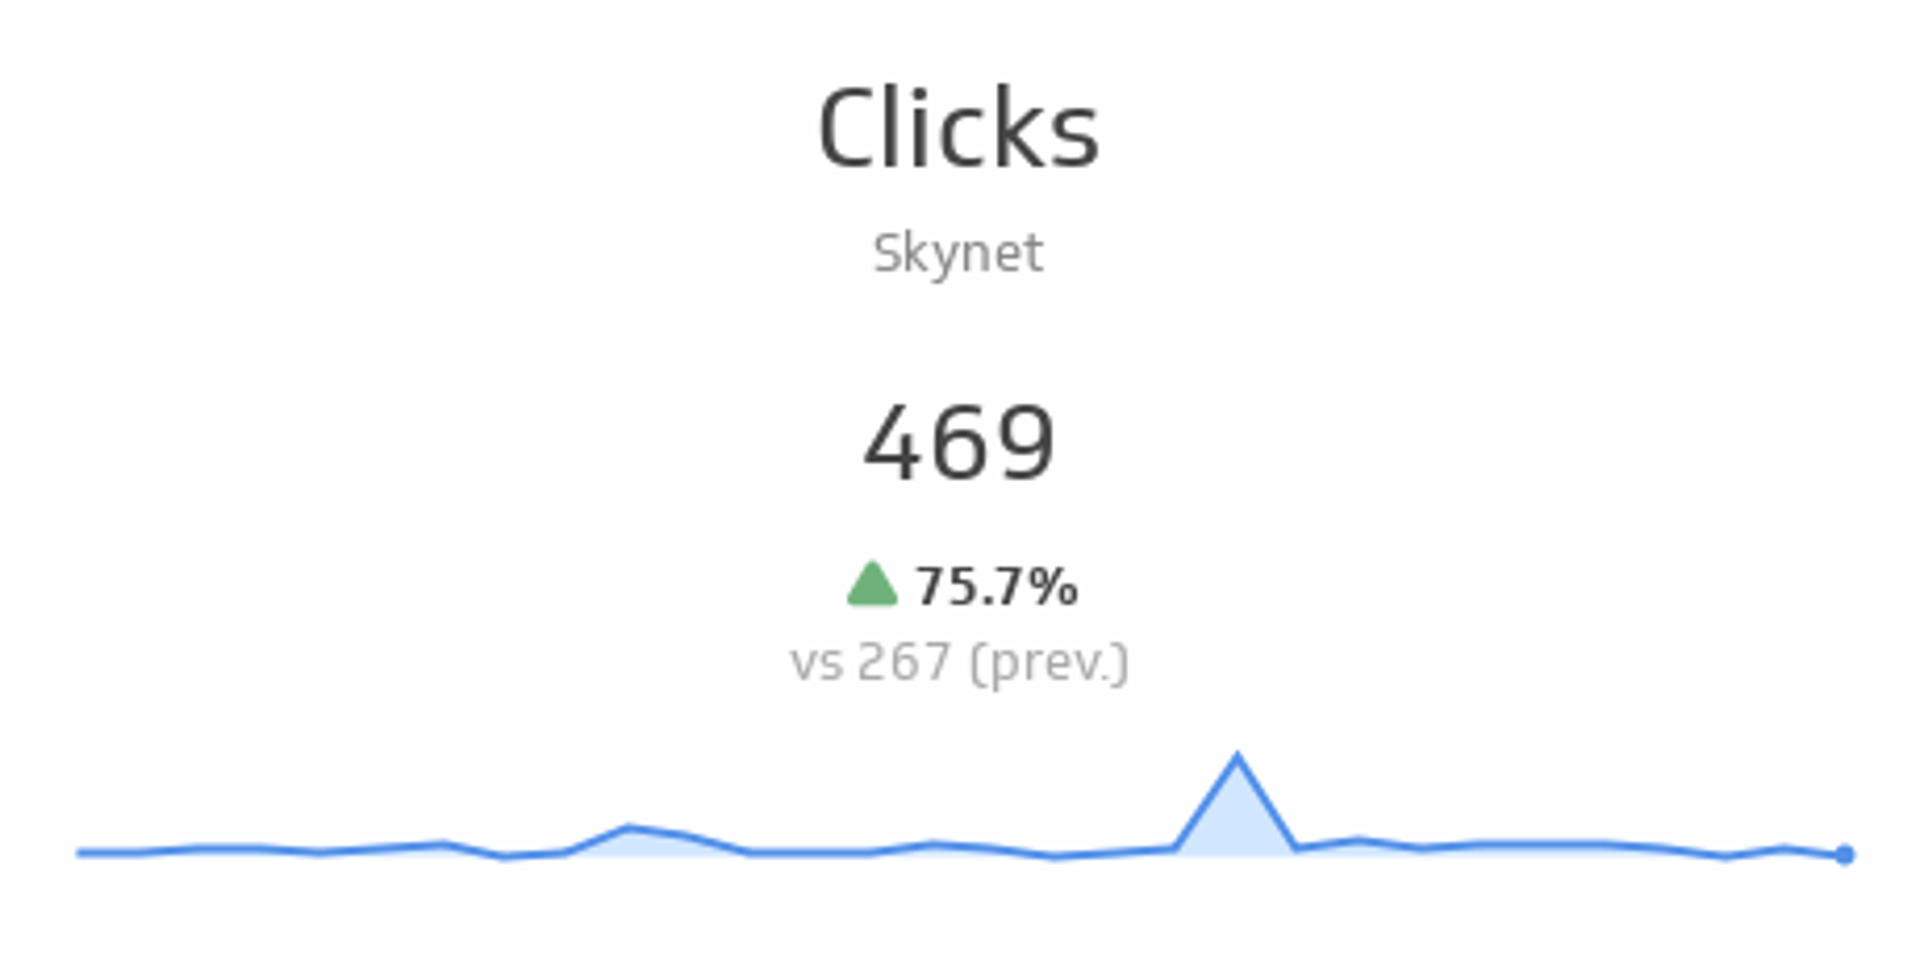
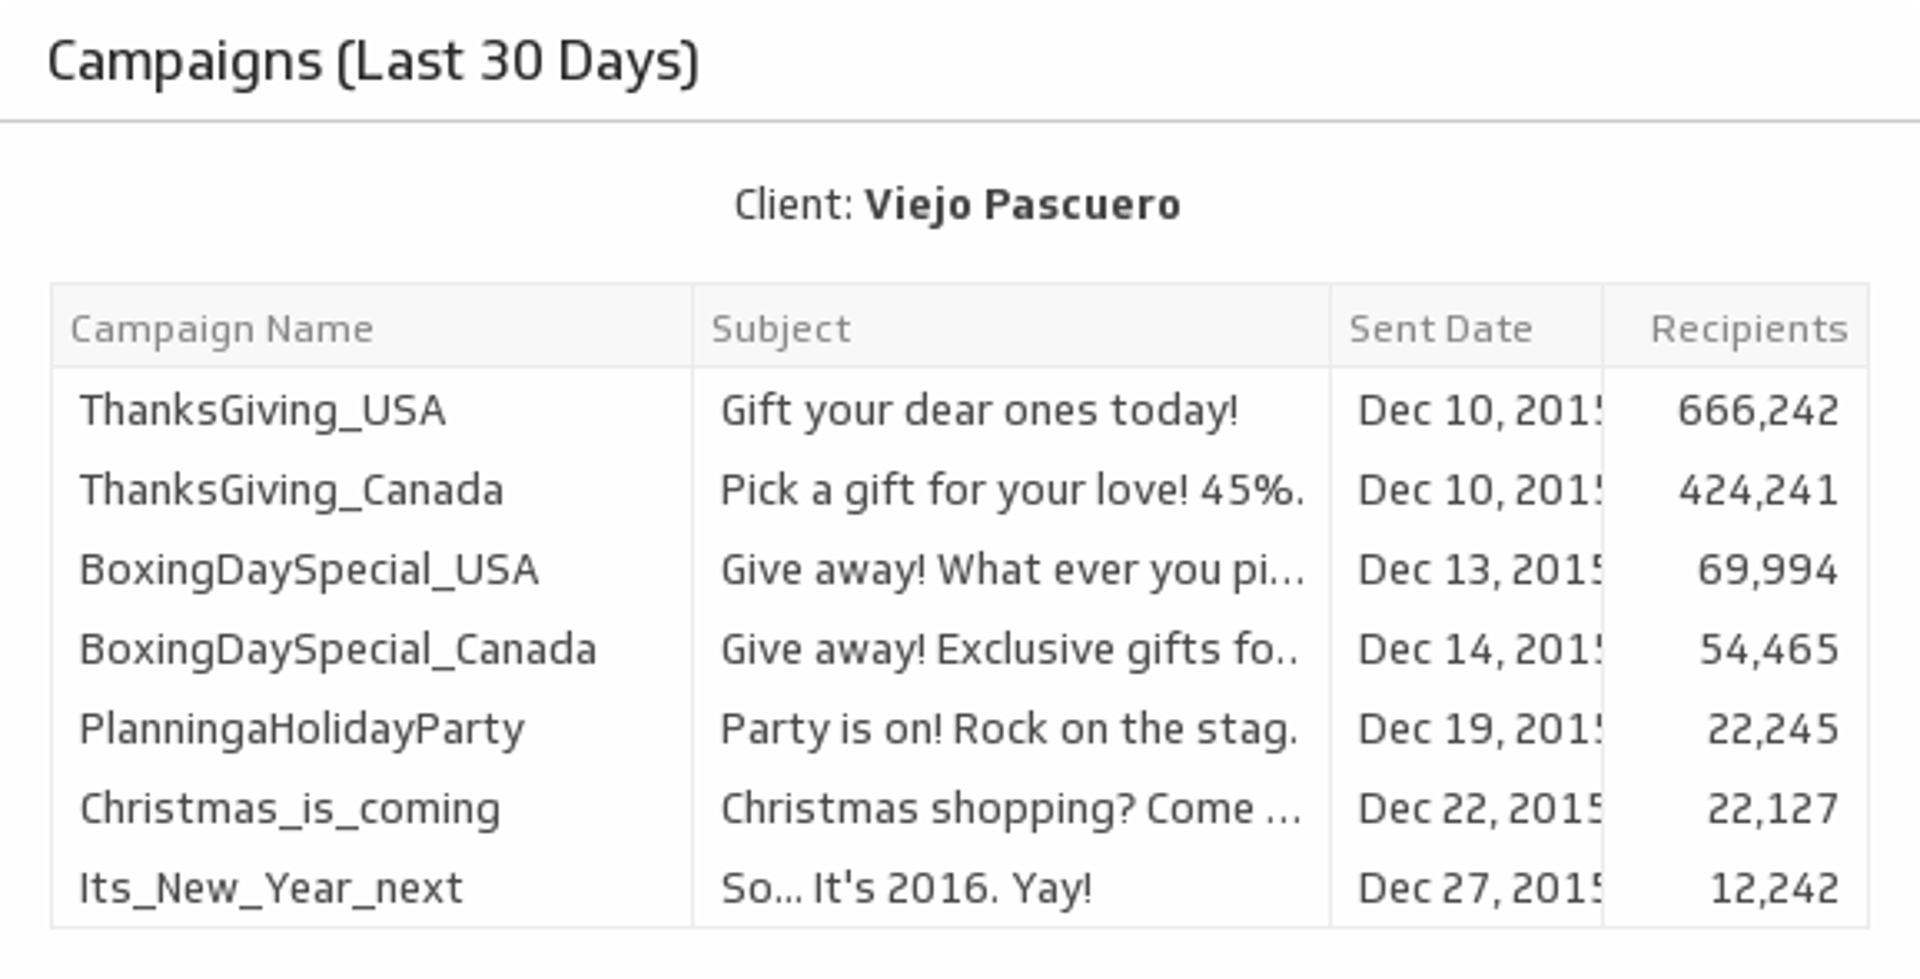
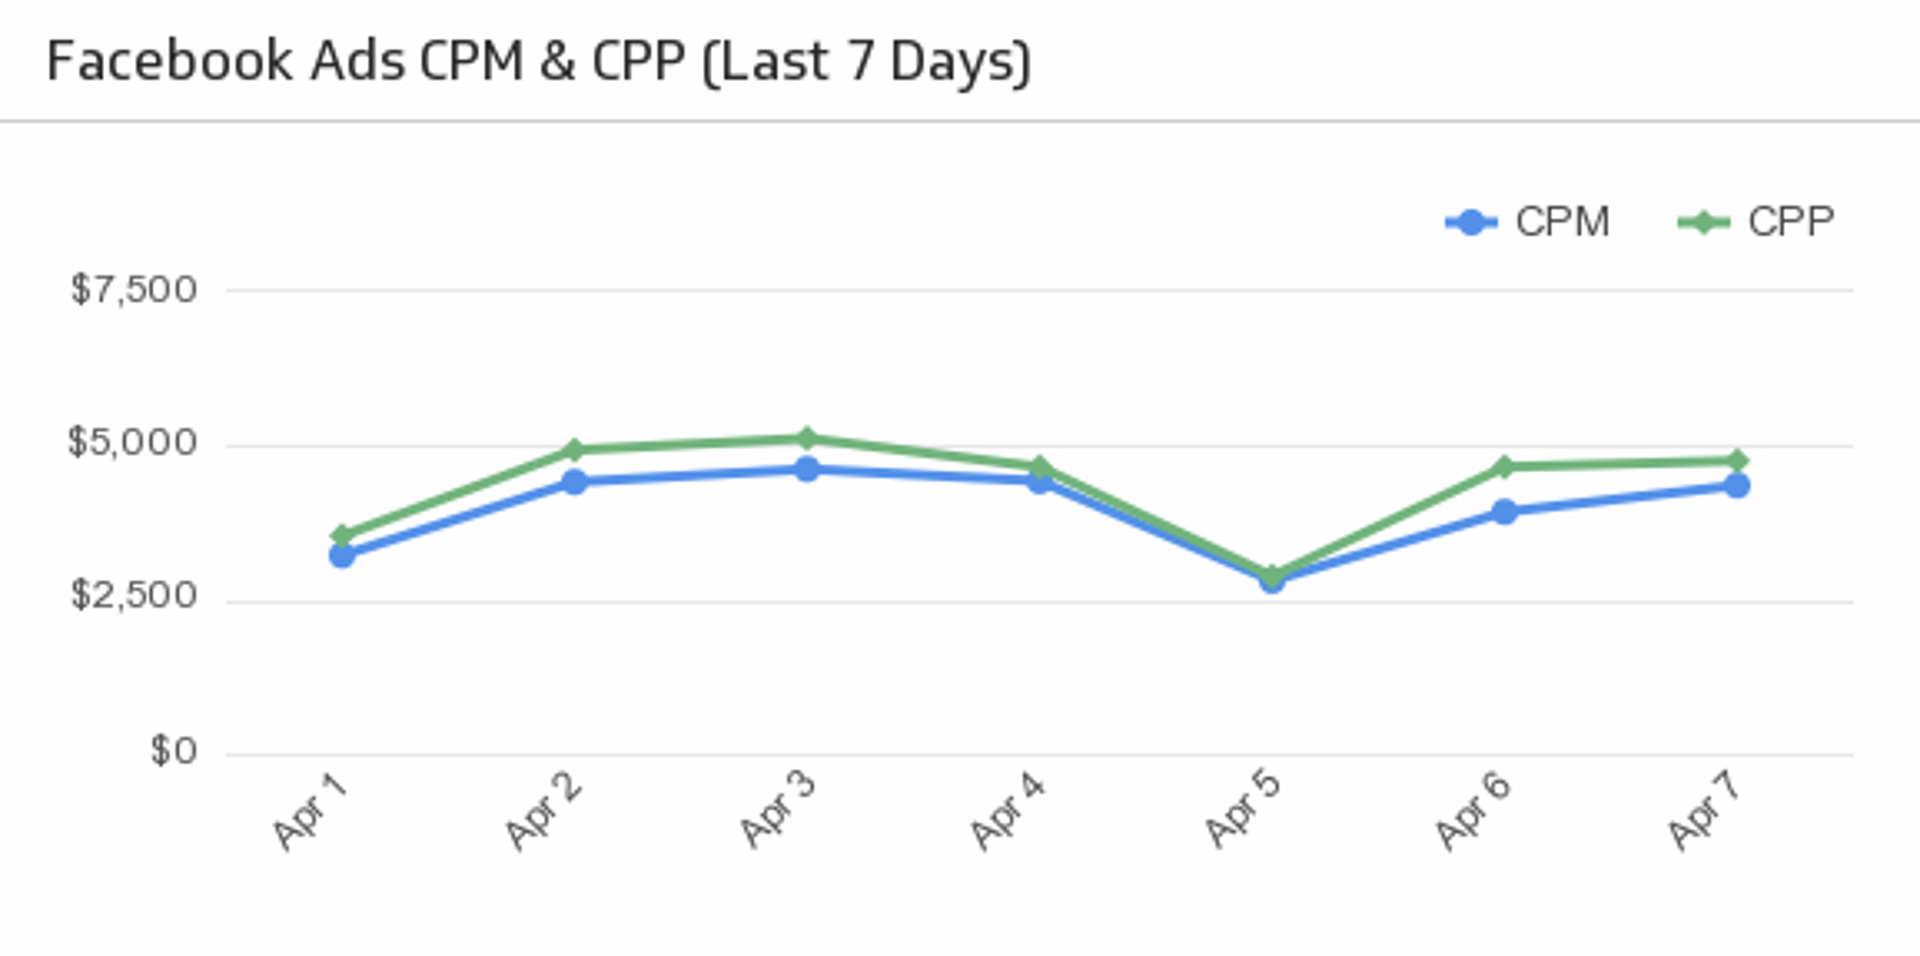
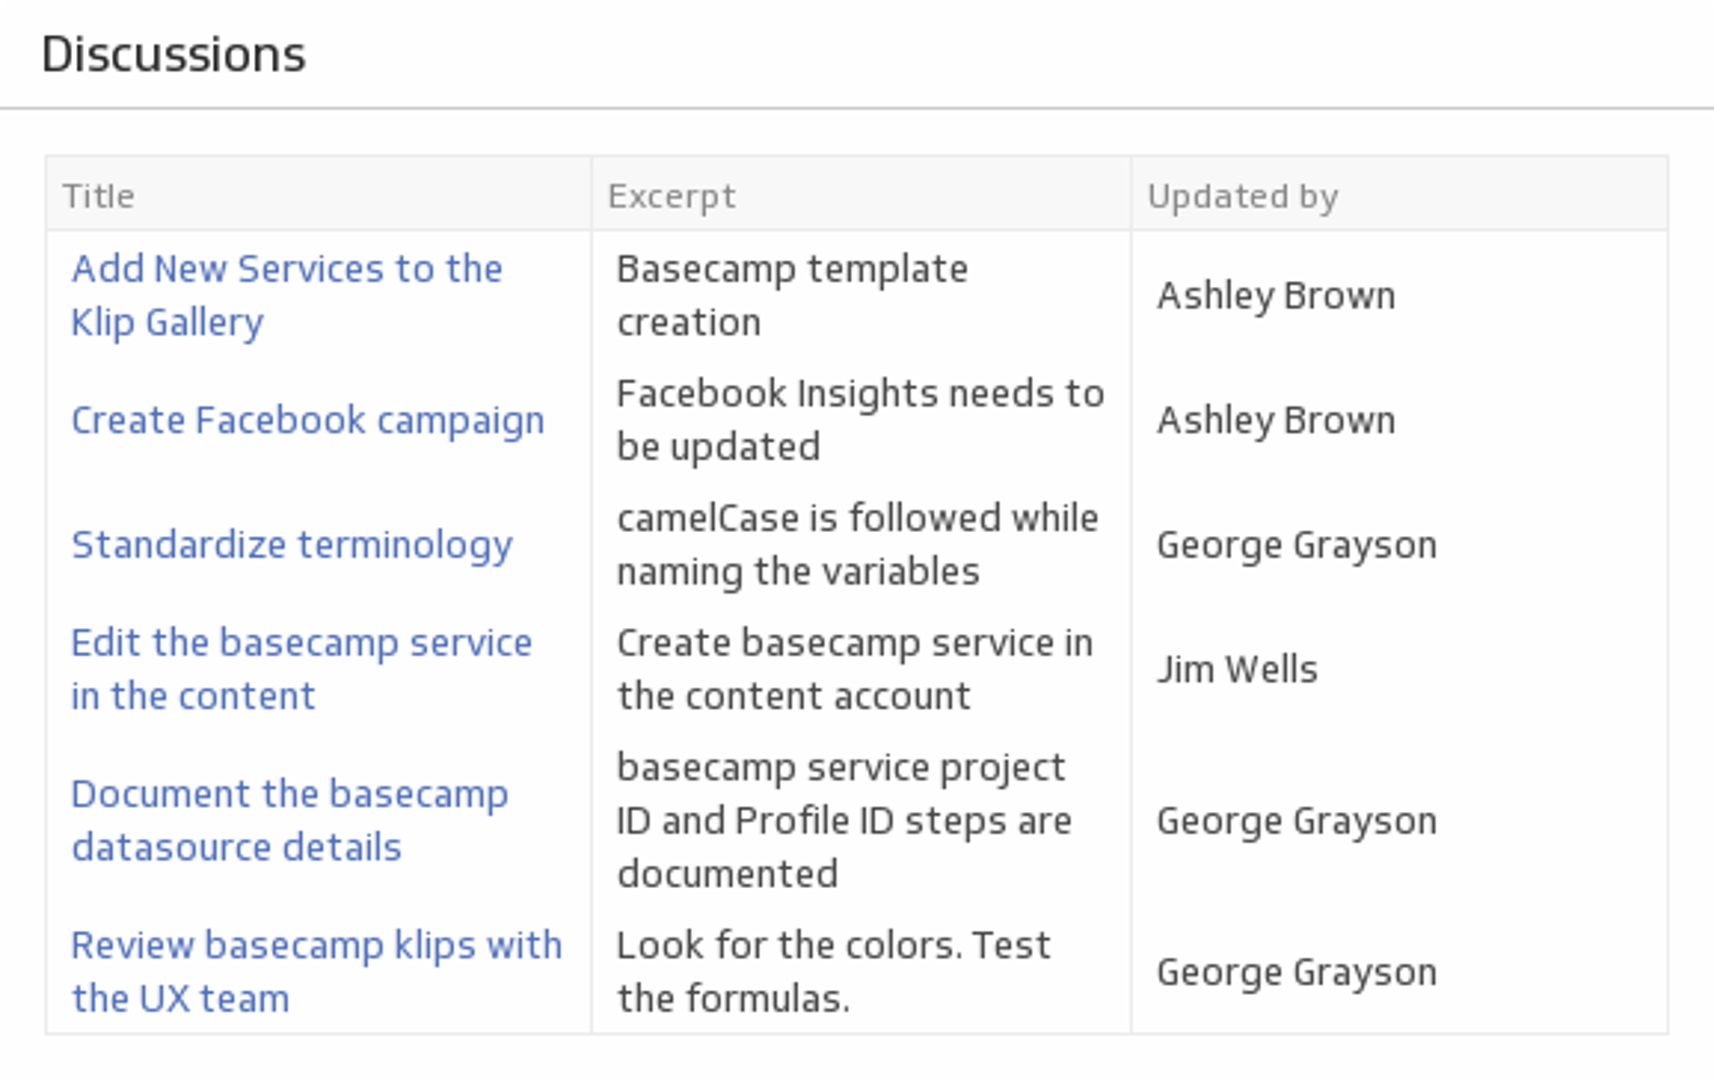
Turn your Amazon Redshift queries into beautiful data visualizations
Tired of running the same queries day in and day out? With Klipfolio, you can use custom queries to build powerful dashboards that update automatically for you. They’re also easy to share with your entire company, so you’ll save hours on manual reporting.
Connect Your Data
With Klipfolio, you can connect directly to Amazon Redshift and 100s of other services. Build queries to specify the data you want to pull in and decide how often you want that data to refresh.
Custom Visualizations
Our custom visualizations make it easy to understand Amazon Redshift queries. Choose from standard data visualizations like charts, bullet charts, and scatter plots. Or get creative and inject custom HTML into your dashboard. The choice is yours.
Sophisticated Formulas
You love working with data and might want to dig a bit deeper. We’ve got you covered. You can use our formula bar to execute calculations, join data, or mashup multiple data sources to create your custom data visualizations.
Sharing Options
You’re asked to run queries for your colleagues day in and day out. Which is why we’ve made sharing easy with Klipfolio. You can send coworkers automated emails, share data through slack, or publish a link to your dashboard.
Automated Refresh
Let your dashboards do all the heavy lifting with flexible refresh rates. Want to see how metrics change minute over minute or day over day? You can customize how often your Amazon Redshift data refreshes in Klipfolio based on your specific needs. From every minute to every day, the choice is completely yours.
Use the Connector Gallery to create a custom Amazon Redshift dashboard
With our Connector Gallery, you can create custom API queries to pull in data from your Amazon Redshift account. Building custom queries allows you to specify the metrics and time periods that you want to track.
You can use custom queries to build out visualizations in Klipfolio. You can also combine your Amazon Redshift data with other relevant data to create your custom dashboard.
Learn more about working with the Amazon Redshift API and how you can start building your own Amazon Redshift queries in Klipfolio.
