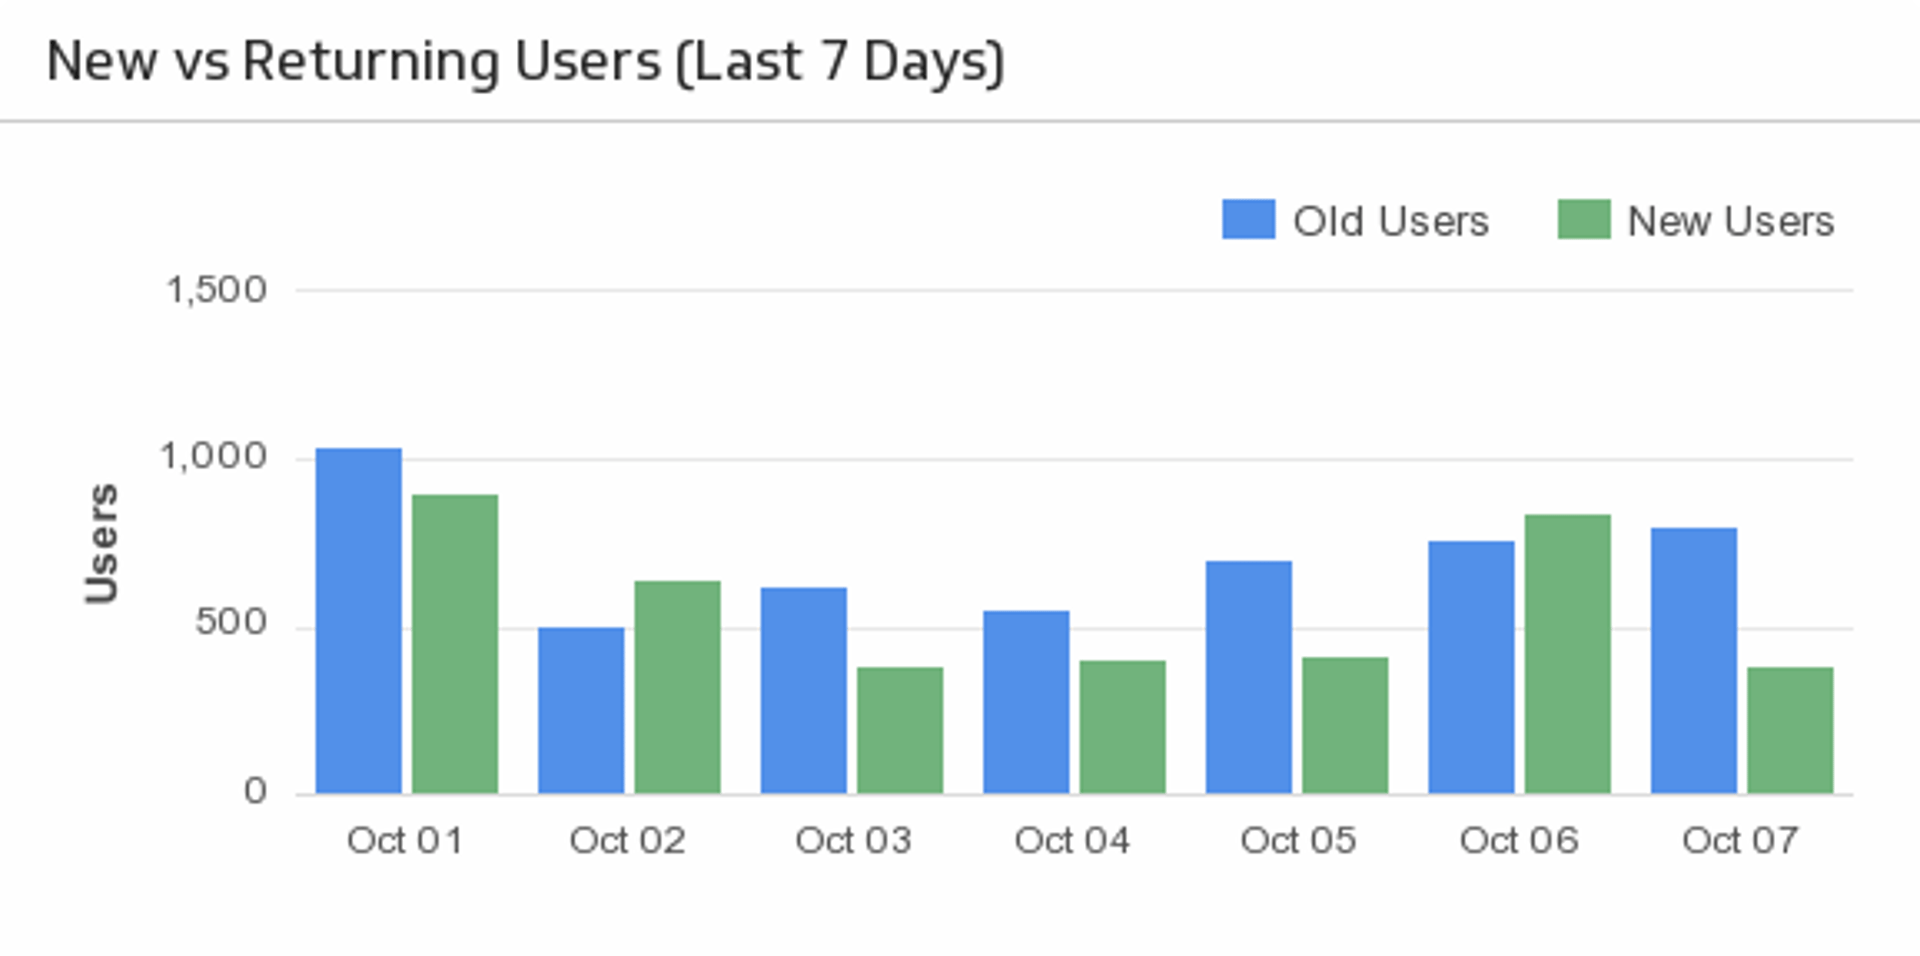
New vs. Returning Users (Last 7 Days)
Use this simple, yet effective, bar chart to compare your new versus returning users over the past 7 days.
Track all your Localytics KPIs in one place
Sign up for free and get started with our New vs. Returning Users (Last 7 Days) Klip.
Get This Klip +Free for 14 days ● No credit card required
Measure how effective your marketing efforts are at driving new users to your content, while comparing against the number of older users that come back to your site.
About the visualization
Gain insight into your users over the past week by getting a clear comparison on how many users are returning to your site and how many users are new to your content.
About Localytics
Localytics focuses on marketing automation that gives you the platform to understand your users and how they are interacting with your product, allows you to send richer messages, and helps you to optimize your ROI.
Related Klips

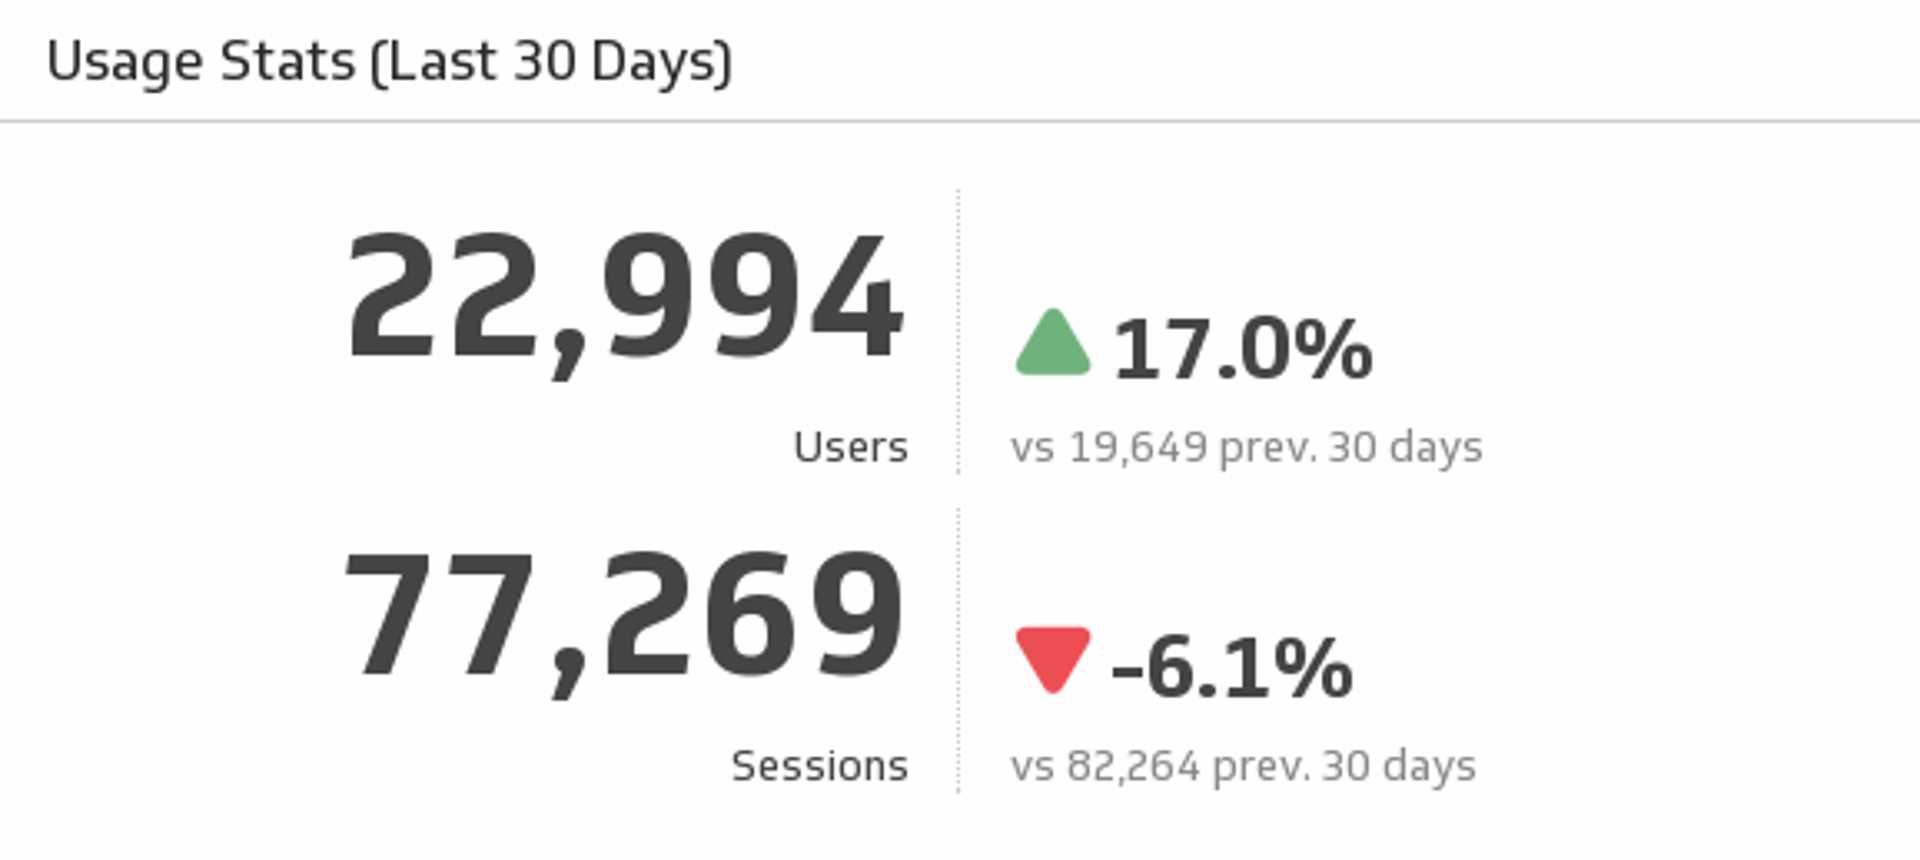
Usage Stats (Last 30 Days)
Track your users and sessions over the past 30 days, and compare it to the previous 30 days.

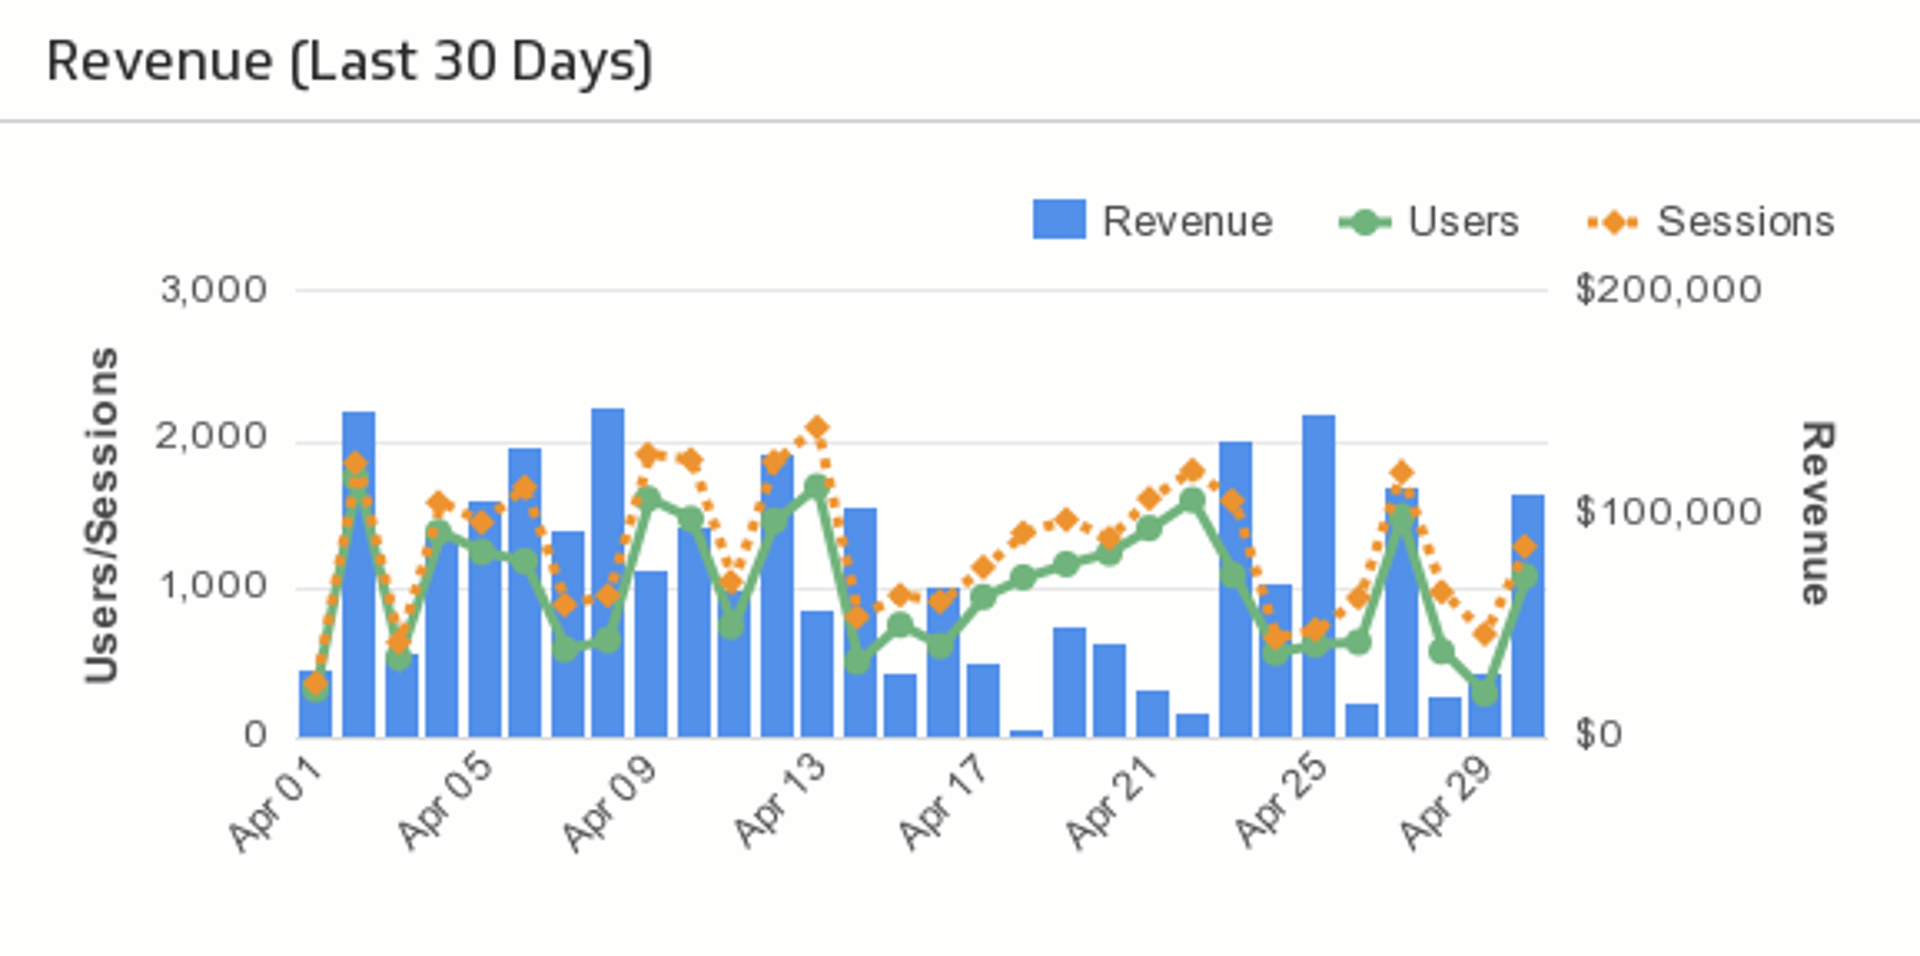
Revenue
Compare your revenue to the number of users and sessions on your app.

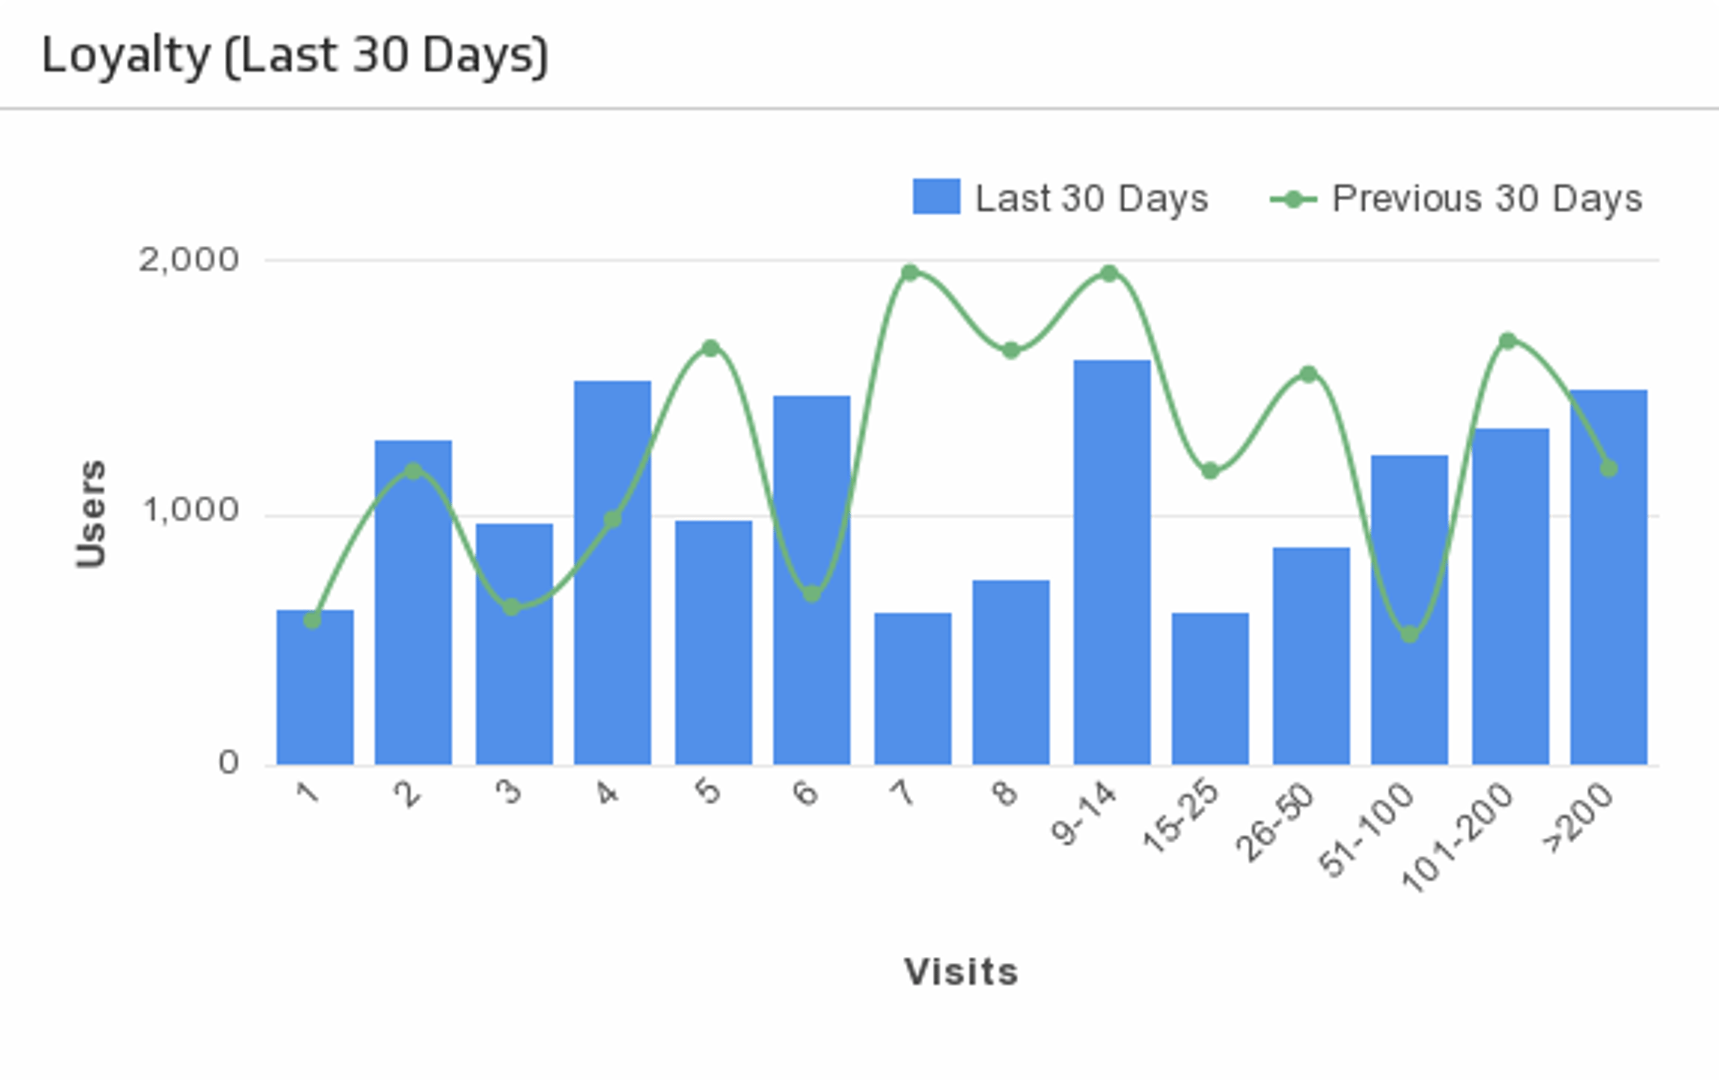
Loyalty (Last 30 Days)
Monitor the loyalty of your website visitors by tracking the number of repeat visits.

