Why customer support should be metrics-driven

Published 2023-02-13
Summary - Keep every aspect of customer support in check by adopting a metrics-driven approach.
Customer support is a space that has a constant hustle and bustle attached to it. With so much going on, sometimes, it can be easy to lose track of the small things. A disgruntled customer who gave a very poor CSAT rating or an agent who is struggling to keep up with their workload might go unnoticed. However, it’s the little things that have a huge impact on your team and their performance.
What can you do to keep every aspect of customer support in check?
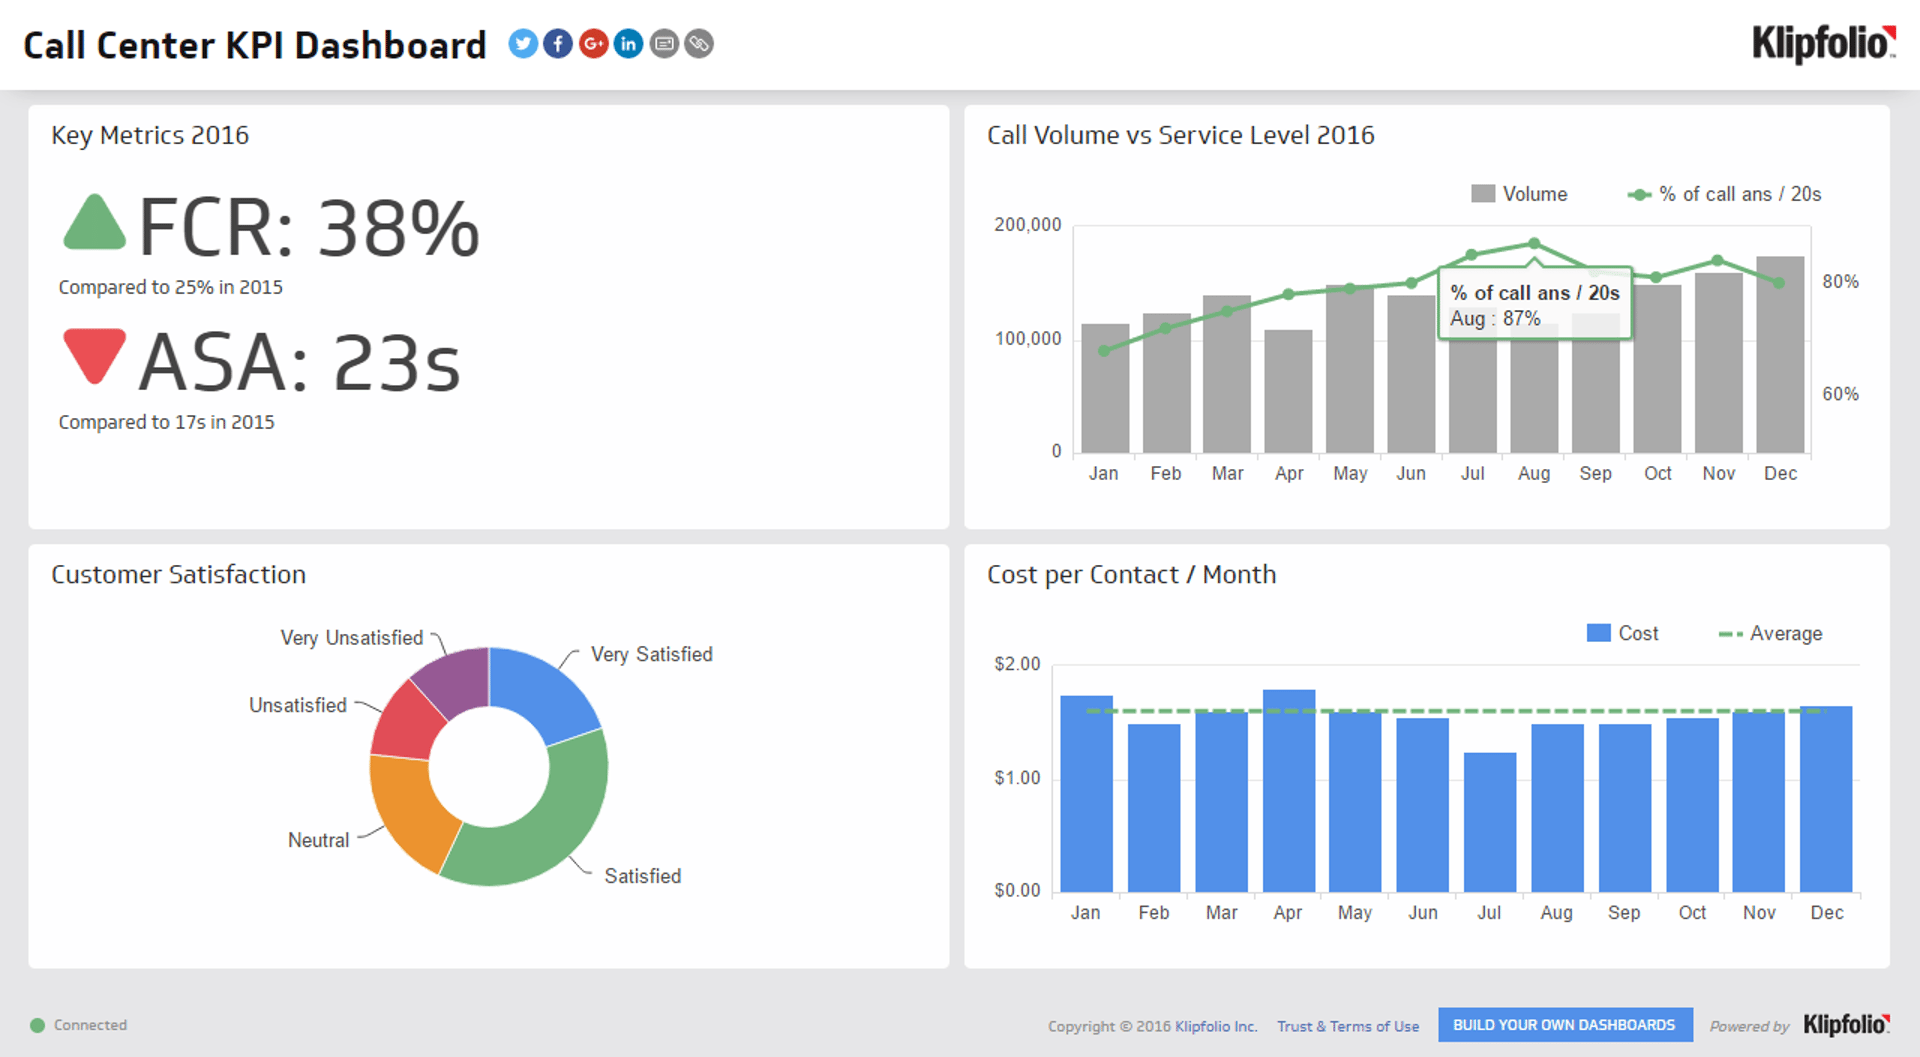
Adopting a metrics-driven approach helps you stay on top of everything that matters to you and your team. Customer support metrics let you quantify all aspects involved—your team, your customer, and your product.
The best way to ensure that nothing slips your eye is to have a live dashboard. Populating data from a customer service management software into a reporting tool such as Klipfolio gives you a holistic view of your support.
Without monitoring customer support metrics, you have no way of telling:
- How happy your customers are
- How well your team is performing
- When the rush hours at work are
- Which channel customers commonly reach out to you from
The benefits of monitoring customer support metrics do not end there. Following a metrics-driven approach helps you:
- Identify bottlenecks and work on them
- Spot red signals like bad CSAT ratings and follow up with customers
- Make quick announcements and broadcast updates to your team
- Motivate your team and keep them on their toes
- Take stock of the number of tickets that are in different buckets
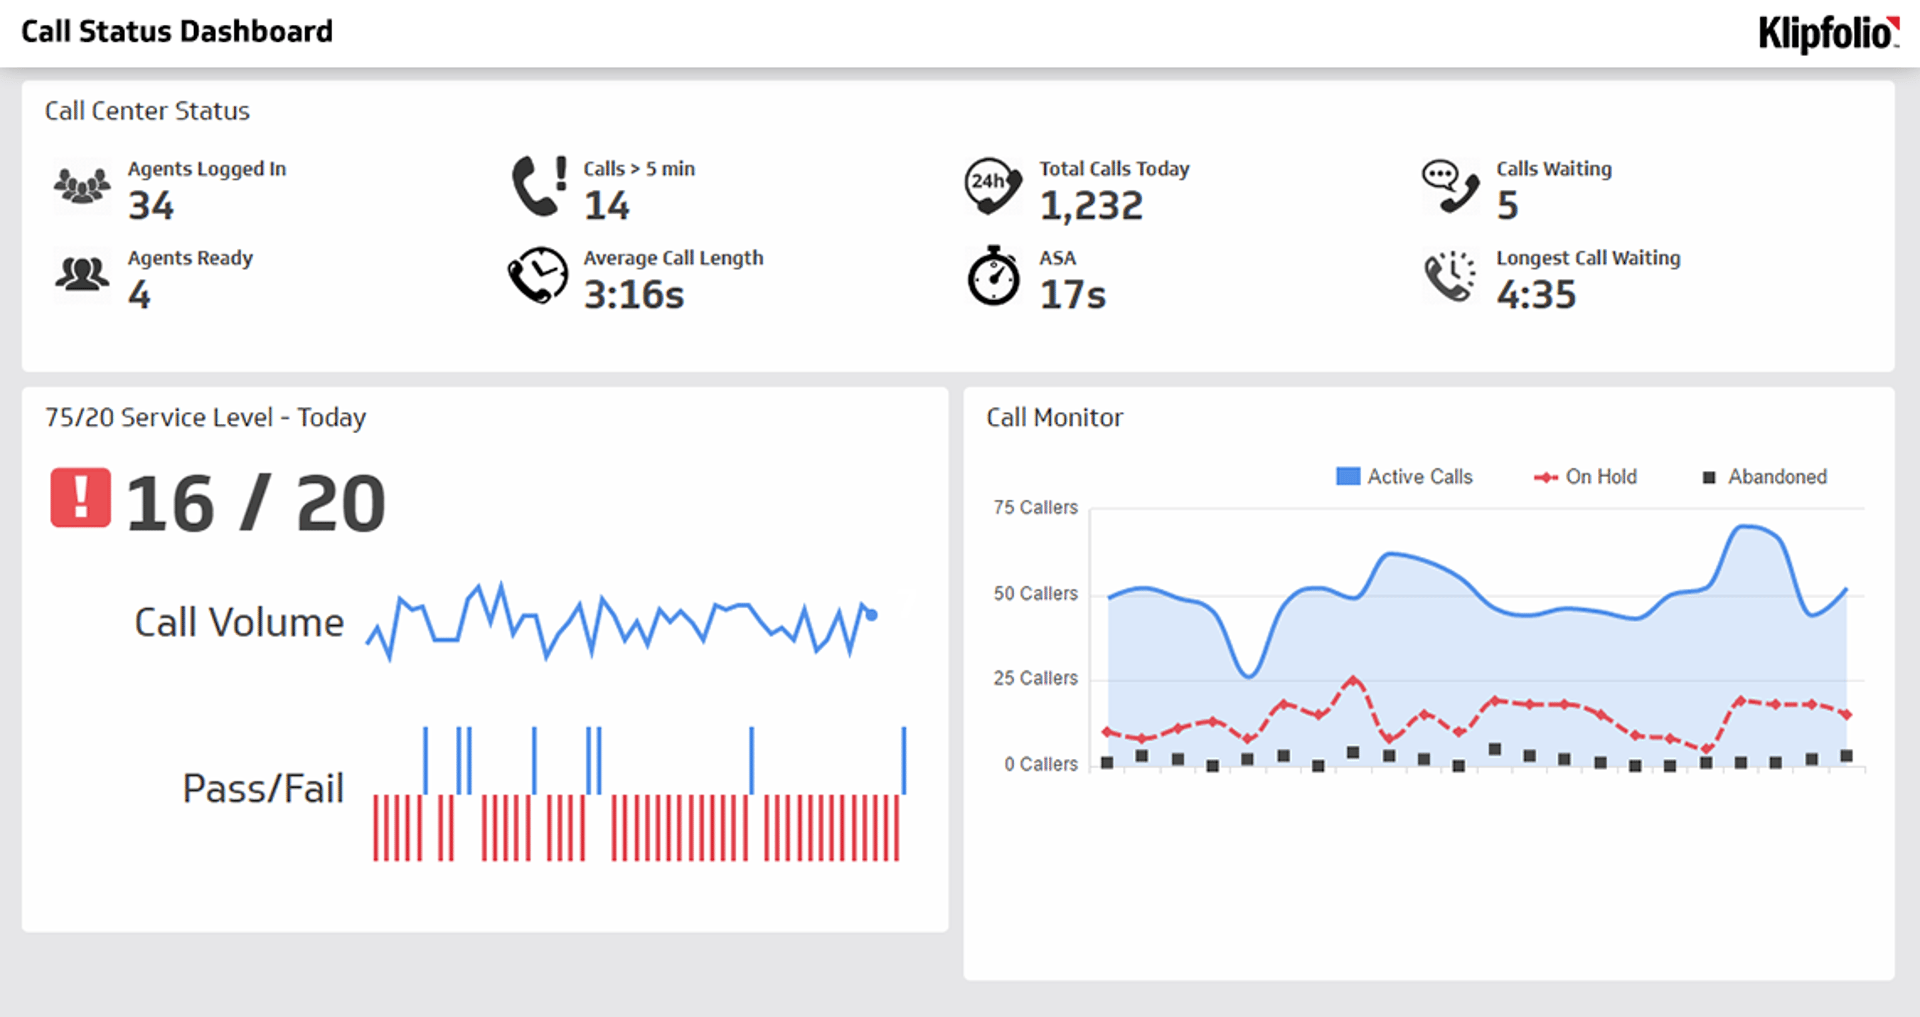
While every customer support metric is worth measuring, different businesses have different priorities. Based on the key performance indicators they set, the customer support metrics they measure change. If you’re a business that is starting out, here are a few metrics that are benchmarked across industries:
Ticket volume
The number of tickets your team receives in a day, week or month gives you the ticket volume. Taking stock of the average ticket count you receive helps you gauge how well your customers know your product. That is, a low ticket volume is a sign that your customers understand your product really well. Whereas, a high ticket volume indicates that there are problems in your product or your product is broken.
How can this help you: As a support manager, you can use this metric to optimize your team’s workflows. With the average ticket count, you can set achievable daily or weekly targets for your team.
To add on, you can also analyze the metrics over a period of time to scout for any peaks or dips in the ticket volume. This is common during holidays or discounts, so you can plan your workflows accordingly.
Assessing the average volume of tickets you receive, also helps set benchmarks for other metrics like the first response time, average resolution time and so on.
First response time
The time taken to reply to a customer after they’ve raised a request, or the first response time, shows how much a brand cares about its customers.
Ideally, a brand that’s focused on delivering great customer support, has a first response time that is quite low. A high first response time implies increased waiting time for customers and results in low customer satisfaction and vice versa.
How can this help you: This metric comes in handy when you want to set up service level agreements. Further, it helps you understand how efficient your team is and tells you whether it is understaffed.
If this metric is alarmingly high, then the brand needs to identify the underlying issue. It is important to do so, as a high first response time can affect other customer support metrics such as the average resolution time.
Average resolution time
The average resolution time metric tells you how long a support agent takes to fully resolve an issue. Customers are already frustrated when they contact support as they're facing problems with the product. Keeping them waiting for long will only accentuate their anger. So, the lower the average resolution time, the better. In fact, 12% of Americans rate their number one frustration with customer service as “lack of speed”.
How can this help you: Your average resolution time helps you understand if you're adequately staffed. You can also gauge your team’s product knowledge. This metric also helps you refine processes. You can identify issues with high-resolution times and assign similar tickets to agents who are most skilled at handling them.
In-queue time
This metric gives you a measure of how long a ticket remains unassigned. Admins and managers need to ensure that this metric does not exceed its limit since you cannot keep your customers waiting for a response.
How can this help you: Sometimes, the number of tickets that are unassigned can shoot up because agents might not be available or when they’re overburdened with excessive workload. In such cases, this metric tells you if your team needs additional help.
First call resolution
The first call resolution gives you the number of tickets that were resolved in a single interaction. If this metric is high, it means things are looking up for you, your team and your customers too. It has been proven that for every 1% increase in FCR, there is a 1% increase in CSAT.
How this can help you: This metric can help you gauge if your team has been trained well. It also helps improve your ticket assignment. That is, you can route tickets to right agents whose expertise can help them resolve tickets in one go.
Although it has been proven that the first call resolution metric directly impacts your CSAT ratings, it might not always be the case. For instance, when a customer does not continue the conversation after the first interaction, the agent might mark the ticket as ‘resolved’. Here the ticket has been resolved although the customer didn’t receive a solution. So, with this metric, it’s best to examine each ticket to gauge how your team is performing.
Average resolution SLA
The average resolution SLA tells you what percentage of tickets were resolved within the SLA. This metric is a reflection of your team’s efficiency. The higher the percentage of tickets resolved within the SLA, the better.
How this can help you: In the long run, reflecting on your resolution SLA can teach you different things. You can also drill down on the tickets whose SLAs were breached to understand why and ensure it doesn’t occur again.
Customer satisfaction
The average CSAT measures the success of your customer service team. It directly tells you what your customers feel about your service.
You can gather this information by asking your customers to rate your service at the end of every conversation and take an average of it. The higher this metric, the better it speaks of your team.
80% of businesses use customer satisfaction scores to analyze customer experience and improve it, according to the Harvard Business Review
How this can help you: The average CSAT metric directly indicates the efficiency of your team. By analyzing this metric, you can make appropriate changes. Right from tweaking agent onboarding to changing workflows, this metric can go a long way in improving your team’s performance.

Wrapping up
In customer support, being metric-driven helps you bring the most out of your team. It allows you to measure the important aspects of customer support—productivity, performance, and quality.
By integrating a dashboard tool to your customer service management software, your team can go a long way in delivering great experiences.
Related Articles
Promoting data literacy with metrichq.org and the power of AI
By Allan Wille, Co-Founder — October 12th, 2023
Let’s fix analytics so we can stop asking you for dashboards
By Cathrin Schneider — September 11th, 2023
Why metrics are the key to confident decision making
By Graham Watts — July 31st, 2023