5 SaaS subscription metrics for financial reporting

Published 2023-07-04
Summary - Where do you do your financial reporting? No matter the platform, there's a common thread when it comes to revenue: that's where the growth happens. Check out the top 5 Stripe metrics you can track for financial performance reporting.
For businesses everywhere, from startups to scale ups, to SMBs and enterprises, there is one metric that everyone measures: revenue.
Where do you track your revenue? Maybe it’s in Stripe, Quickbooks, or Xero—maybe it’s a combination of all or none. And perhaps you look at your revenue across a number of additional data sources like Google Analytics, Facebook Ads, HubSpot, or a tried and true spreadsheet.
No matter what or where, there’s a common thread when it comes to money: that’s where the growth happens. And when your revenue grows, so does your company.
Forecast revenue and analyze trends
With Stripe, you can analyze record level details or very high-level data but there’s not much room to play in-between. The good news is that our suite of instant metrics (across all data services) can help you set up a dashboard in minutes so you can track your Stripe metrics with the depth and granularity you need to forecast your revenue. Your dashboard should help you answer questions about your finances and the overall health of your business. And when you share it with others in your organization, it should pique their curiosity to ask questions, too.
Segment, filter and breakdown your Stripe metrics
For the purpose of this post, I’m going to focus on our Stripe instant metrics.
Revenue forecasting means recognizing your cash flow over the next day or two, next week, and especially at month or quarter end.
When you use Stripe instant metrics in your PowerMetrics dashboard, you can get granular. You can break down your payments to see fees, the distribution of refunds, your cash-in, or failed charges and recognize patterns and trends. Instant metrics allow you to segment your data so you can look at it by country, card type, or even product across a number of visualizations, including bar charts, pie charts or line charts.
The top 5 Stripe instant metrics you can add to your dashboard
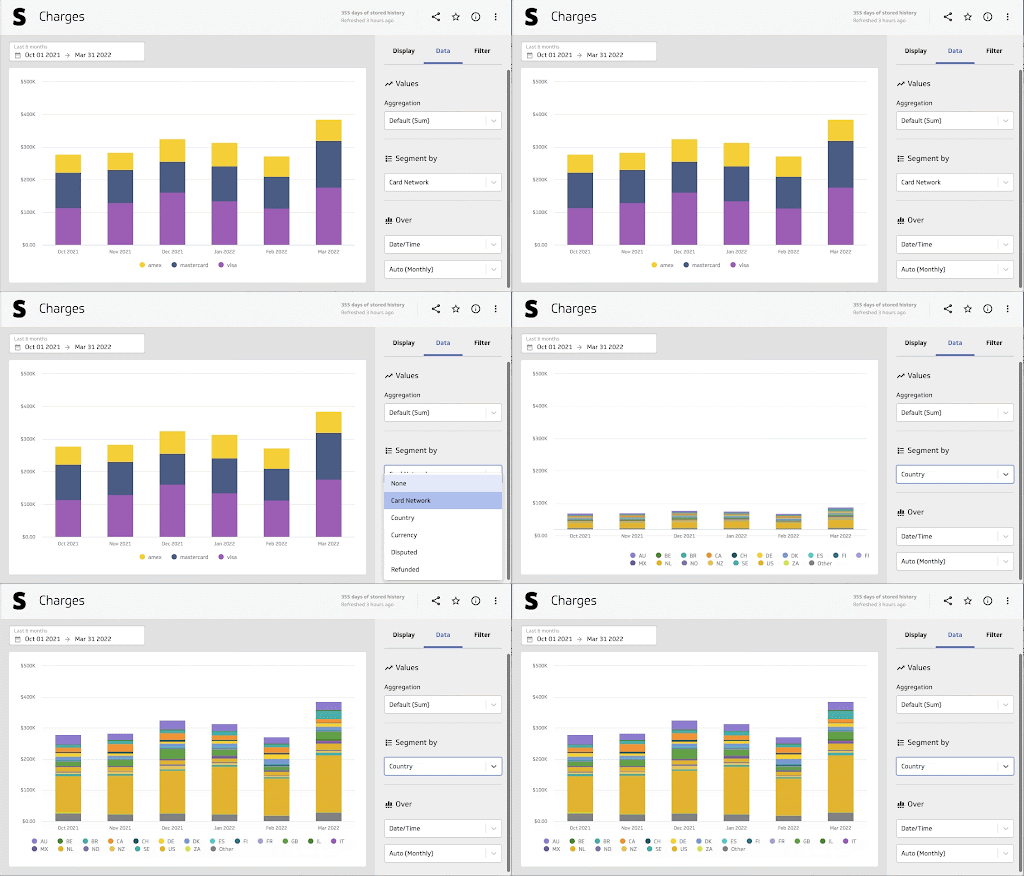
Charges
Charges is your total payment revenue after you deduct fees, refunds, transfers, and disputes. Charges represent your gross volume in Stripe. You can segment this metric by card type, country, currency, disputed, or refunded to give you a micro-level look at where your charges are coming from, and if any are disputed or refunded for accurate financial reporting.
Payment Acceptance
When a payment is charged, it’s money in the door for your business. Payment acceptance is a Stripe metric that visualizes the percentage of successful payments (out of all attempted payments) so you can predict your cash-in and cash-out. You can break down this metric by card type or country, too.
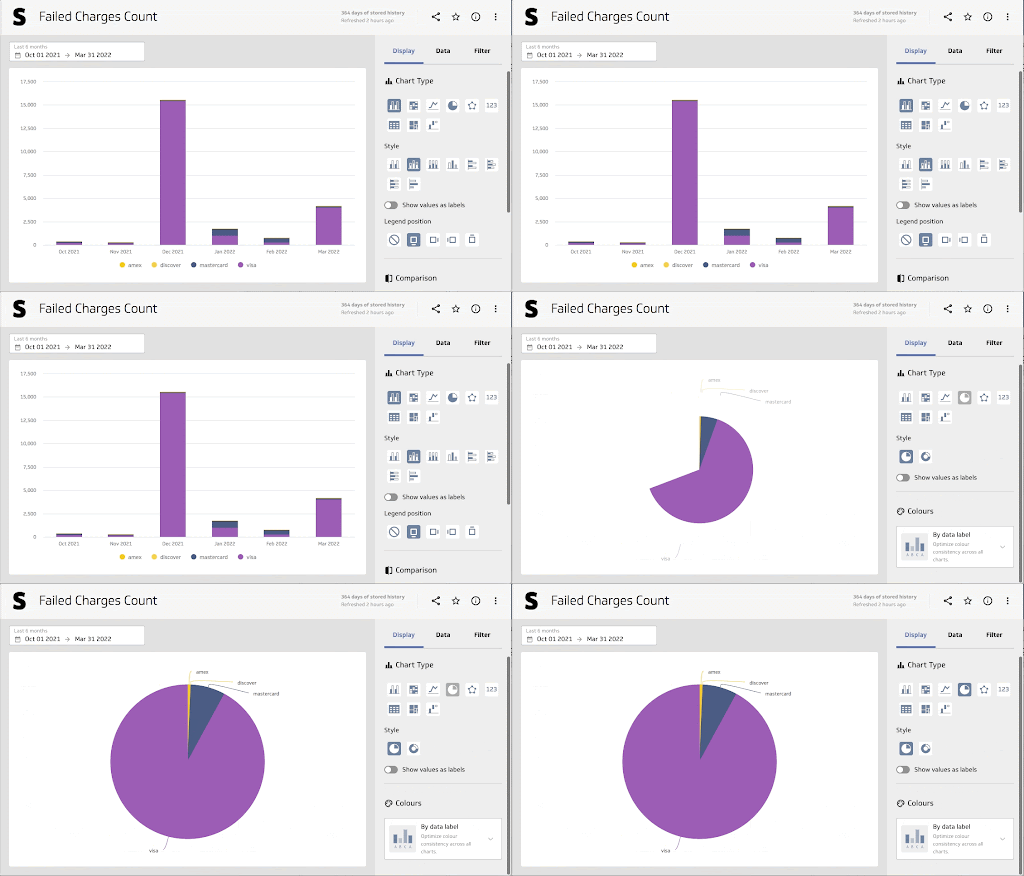
Failed Charges
In Stripe, failed charges represent the total monetary value of payments that have failed. You can also view failed charges as a count. When you add the failed charges instant metric to your dashboard, you can look at declined payments, blocked payments, and invalid payments by card type, failure message, reason, and currency. This metric allows you to spot fraudulent behaviour and quickly identify issues.
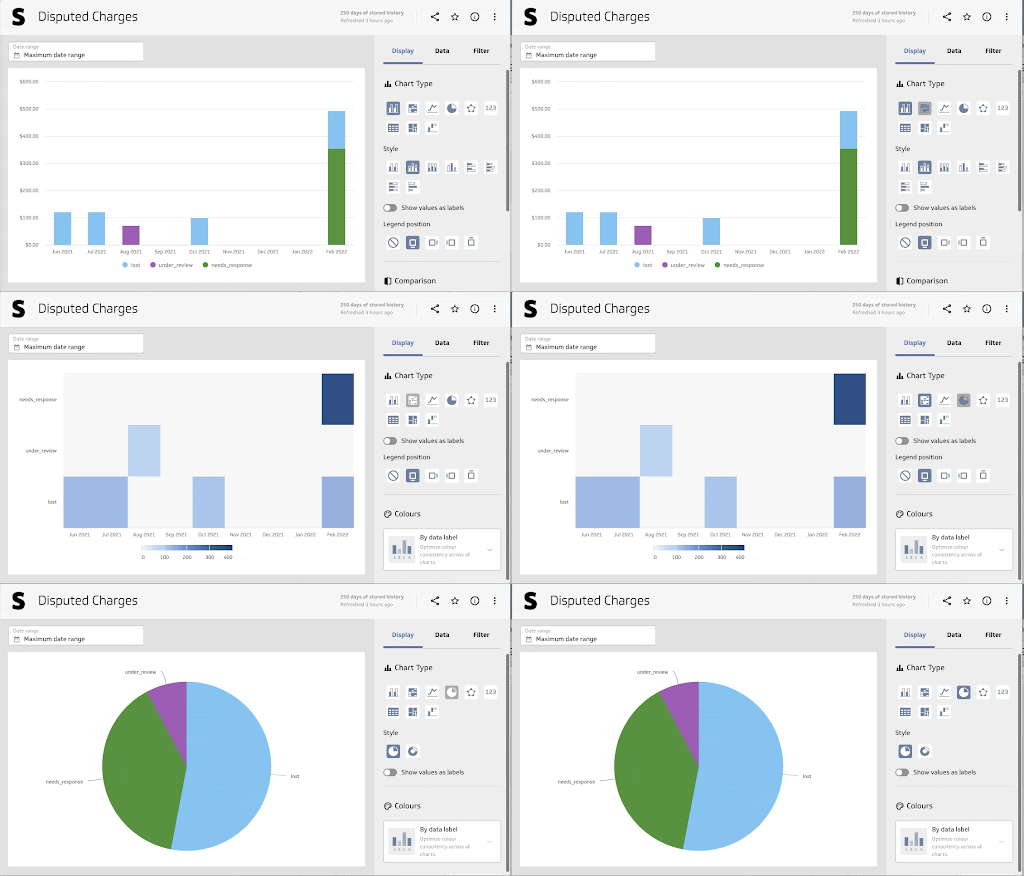
Disputed Charges
To round out the way you can look at charges from Stripe, disputed charges is the total value of charges that have been challenged or reversed, so this metric represents the money that could be deducted from your net charges. If you see a spike in your disputed charges, it’s a good opportunity to reach out to your customer success team to see if it correlates with any support tickets they’ve received in that time frame.
Payouts
Payouts is the money that you receive from Stripe after payments, charges, etc. have been accounted for. It’s not your MRR or your revenue, but it’s a helpful metric to see how you can manage your cash. This is probably the most important metric for revenue forecasting because it’s the dollars in your pocket at the end of your payout schedule.
Maximize your revenue potential
The Stripe instant metrics available in PowerMetrics are just the start. Explore the data services available to maximize your revenue potential and drive full-funnel accountability. When you track the marketing dollars spent for every new lead to your forecasted sales revenue, you can see how your money flows across every channel.
Related Articles

Promoting data literacy with metrichq.org and the power of AI
By Allan Wille, Co-Founder — October 12th, 2023
Let’s fix analytics so we can stop asking you for dashboards
By Cathrin Schneider — September 11th, 2023
Why metrics are the key to confident decision making
By Graham Watts — July 31st, 2023