Two reasons why you should leverage self-service BI

Published 2023-09-27
Summary - In almost any organization there are two primary use cases for BI: Reporting and data exploration.
The real test of any BI solution is how quickly a business user can answer their questions and get to the data they need. There’s a whole industry of expensive enterprise BI tools purporting to deliver on the value of self-service BI.
In a small, agile team environment you won’t have the luxury of relying on a corporate BI infrastructure (or won’t want to because it doesn’t have what you need) and so the challenge is even more acute - you’ll need to build it yourself.
Here’s a few things you need to know to demystify self-service BI and learn how Klipfolio delivers a flexible solution that won’t break the bank.
Consider your use cases
In almost any organization there are two primary use cases for BI:
- Reporting
- Data exploration
Reports and dashboards are used for regular status checking whereas self-service data exploration is for on the fly analysis to support a change or decision. The ability for a decision maker to dig deeper into their data without the need to call on a data analyst to help them is critical for creating a self-service data culture.
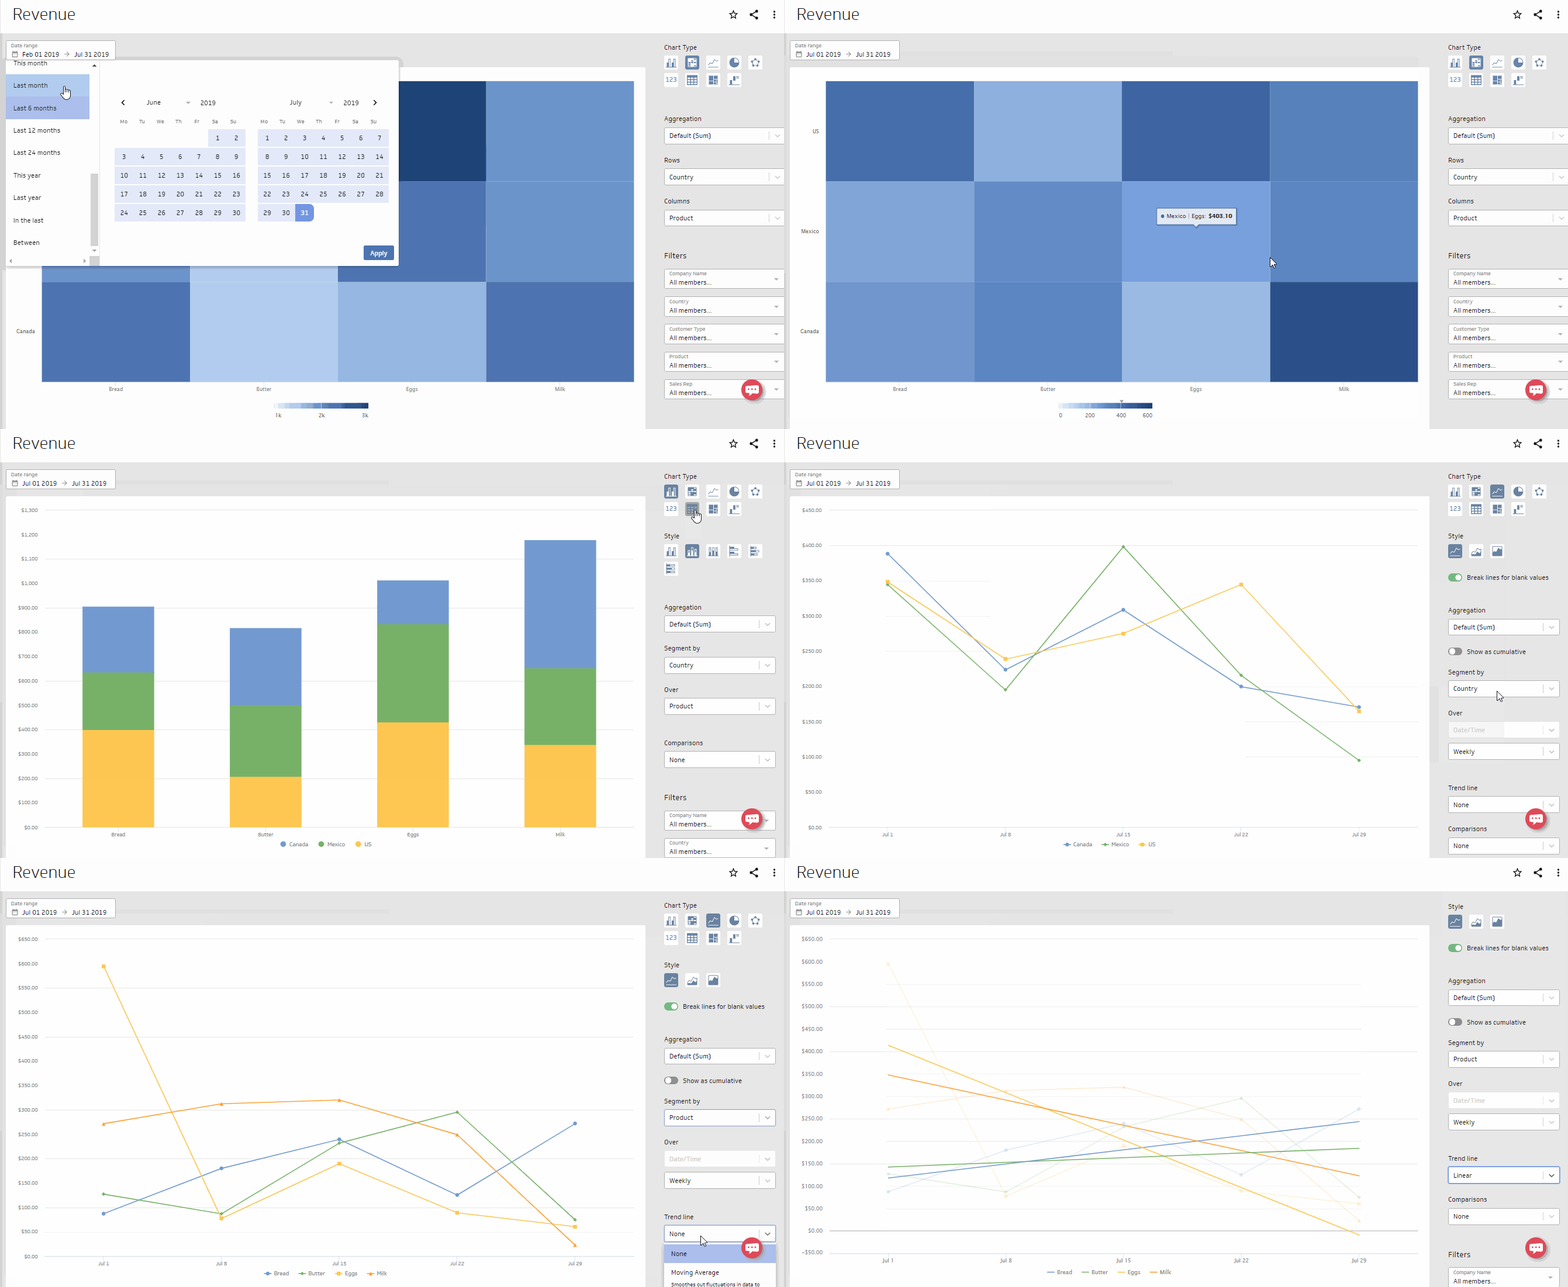
Key features that support self-service BI are the ability to change the date range, adjust other data filters, switch the data visualization, add trend lines or other comparisons, and change how the data itself is broken down.
A BI solution that delivers this kind of data flexibility becomes really powerful because it effectively means that an end-user can create any type of data visualization they need, and building their own dashboard or report should be an easy next step.
Klipfolio recently introduced a new easy option to address exactly this challenge. It’s based on a new type of building block we’re calling the PowerMetric.
Scale your expertise and give decision makers the control they want
In a BI solution that supports self-service, end users get more control over how they view their data. That means fewer requests for one-off reports or constant adjustments to answer specific questions that invariably come up.
When you choose a BI solution that has self-service capabilities designed in, your time becomes more valuable because you can focus on the data prep activities and let your end users answer their own questions and create their own reports.
Here’s how you can use PowerMetrics in Klipfolio to visualize data quickly and deliver a self-service experience for your decision makers.
How does Self-service Reporting work?
Report building in our self-service experience with PowerMetrics is a matter of configuring different data visualizations as you can see in the video above.
The magic lies in the PowerMetric itself. It’s a data container with a multi-dimensional model designed to represent the many different ways people will want to view their numbers. For example, a Revenue PowerMetric may contain dimensions for Products, Sales Territories, Sales Reps, Countries or Regions, or any other dimension of the data that may be valuable.
When you use PowerMetrics in Klipfolio, they unlock all kinds of smart, built-in features that help you define data visualizations quickly and easily. End users can explore the data within one or more PowerMetrics with an easy menu of configuration options.
Dashboard and report building becomes a simple exercise where users snap together multiple visualizations on a canvas with a built-in date range and common filters.
How do I create PowerMetrics?
Klipfolio has pre-defined PowerMetrics for popular data services or you can create your own custom PowerMetrics for any of the data integrations we support.
To define a PowerMetric requires data organized in columns that include the metric values you want to track and any other columns of data that provide a breakdown of the data your users might be interested in. You can merge 2 or more data sources together into a single PowerMetric to combine your data or create calculated PowerMetrics.
When you create a PowerMetric, a data connection is established which will pull data into your PowerMetric on a regular schedule and there’s a data model that’s generated as well. You can prep your data in Klipfolio by using our Excel-like formulas and functions. This makes it easy to create buckets within your data that will improve the end user experience.
Curated Data for Trusted Metrics
PowerMetrics not only give you speed and agility to support the self-service BI use cases of reporting and data exploration, they’re also a great way to deliver curated data your end users can trust.
Each PowerMetric becomes the single version of truth for a particular metric or KPI your organization relies on to make decisions. When you know everyone is working from the same curated data sets, the level of trust in the data goes up and people become more confident making data informed decisions.
Related Articles

2025 BI and Analytics Trends for Small and Mid-Sized Businesses
By Allan Wille, Co-Founder — December 18th, 2024
Promoting data literacy with metrichq.org and the power of AI
By Allan Wille, Co-Founder — October 12th, 2023
Let’s fix analytics so we can stop asking you for dashboards
By Cathrin Schneider — September 11th, 2023