Case Study: How Sanoma gets the big picture with Klipfolio Dashboard

Published 2026-01-29
Summary - When you’re a leading consumer media company managing multiple broadcast and online content delivery channels, how do you stay on top of and fully utilize the constant torrent of data? The answer, for Finnish broadcaster Sanoma, is to use Klipfolio Dashboard. Check out this case study and see how Sanoma gets the big picture.
You can download your copy of the case study using this link:
Case Study: How Sanoma gets the big picture with Klipfolio Dashboard
Here’s an excerpt of the study to whet your appetite.
Like many media companies, Sanoma understood that it needed to provide the sports, entertainment and information programming its viewers demanded, whenever and wherever they wanted it. That meant the launch of new online streaming and web-based content in addition to the organization’s already leading traditional broadcast services.
These new content distribution channels created new opportunities for Sanoma to expand its viewership. It also created new complexities for tracking and metrics management. The online streaming created a torrent of new data about viewership behaviour and content consumption patterns that needed to be effectively tracked and analyzed.
Dedicated web analysts were spending at least a half day a week simply to create PowerPoint reports for management team meetings and weekly reports. The heavily manual process was both unwieldy and time-consuming. He knew there had to be a better way.
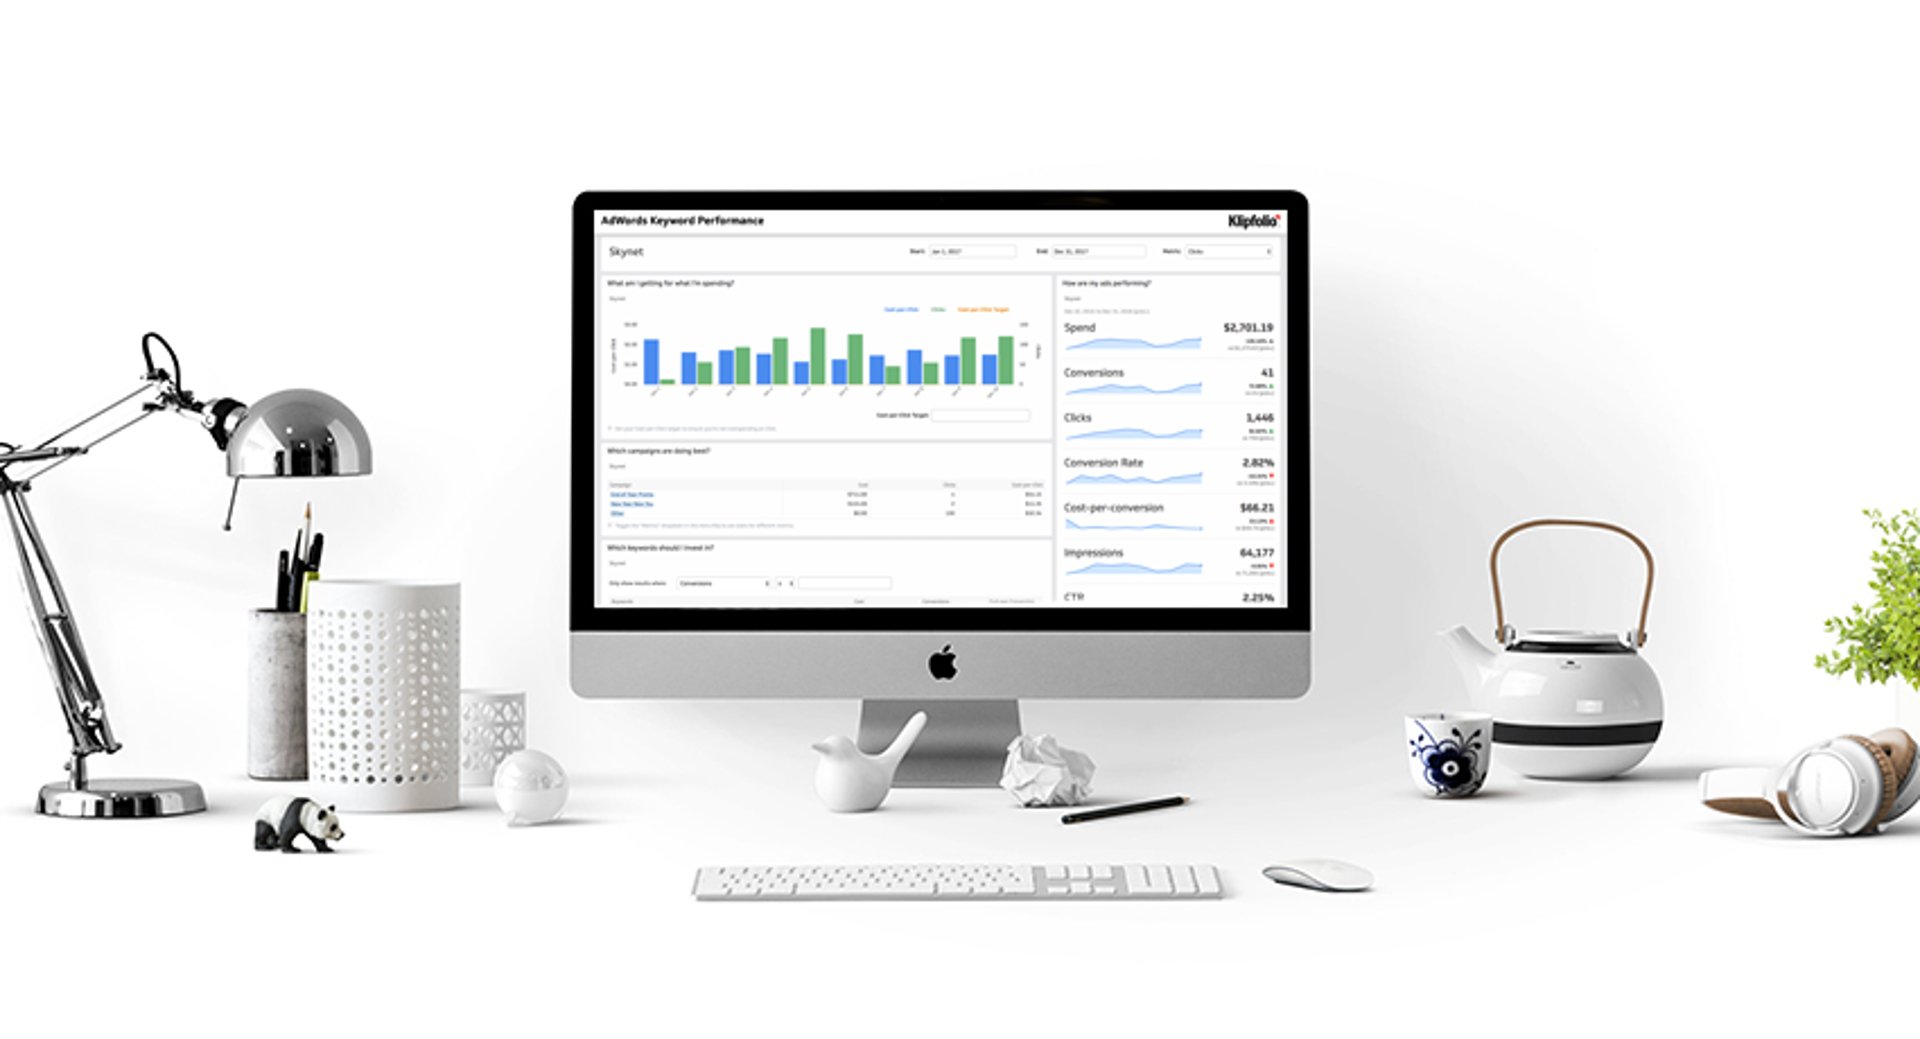
Petri Mertanen saw Klipfolio Dashboard demonstrated at the Google Engage conference in Helsinki. Seeing the ease with which disparate data sources could be integrated into a single dashboard and how quickly dashboards could be created for web and mobile delivery, Mertanen thought the team might have the solution to Sanoma’s requirements.
Mertanen left the conference and started a Klipfolio trial. By the end of the first weekend, he had a sample dashboard to show Mr. Kai Taka-aho, VP of Online at Nelonen Media. "I started my trial on Friday, and by Monday I had prototype dashboard. He was impressed with the interactivity of the visuals and that he could view the dashboard on a mobile device so I got permission to proceed."
Case Study: How Sanoma gets the big picture with Klipfolio Dashboard
Related Articles

How we automated reporting for 50+ clients
By Tommi Salenius — April 14th, 2022
Pauw Agency brings transparency to the music industry with Cervinodata
By Erik van Dorp — September 29th, 2020
Three Ways Unito Uses Data As Rocket Fuel
By Lauren Thibodeau — September 25th, 2020

