Return on Incremental Invested Capital (ROIIC)
Return on Incremental Invested Capital (ROIIC) measures how efficiently a company generates profit from new capital it deploys. Use it to decide whether the next dollar of investment is worth spending.
Return on Incremental Invested Capital
Return on Incremental Invested Capital (ROIIC) measures how efficiently a company generates profit from new capital it deploys, beyond what it was already earning.
Unlike Return on Investment (ROI) or Return on Equity (ROE), ROIIC isolates the return on new spending, not the full capital base. That distinction matters when you're deciding whether to expand, acquire, or invest in a new initiative, because it tells you what the next dollar of capital is actually worth.
What is Return on Incremental Invested Capital?
Return on Incremental Invested Capital (ROIIC) is a financial metric that measures the return generated from additional capital deployed into a business, relative to the operating income that capital produces.
In plain terms: if you spend more to grow, ROIIC tells you whether that spending is paying off.
How to calculate Return on Incremental Invested Capital
The calculation has three steps.
Step 1: Find your Incremental Operating Income. Subtract operating income before new investments from operating income after those investments are in place.
Step 2: Find your Incremental Invested Capital. Total the additional capital deployed, including capital expenditures, acquisitions, and other project-specific spending.
Step 3: Divide. Divide Incremental Operating Income by Incremental Invested Capital. The result is expressed as a ratio or percentage.
ROIIC formula
ROIIC = (Operating Income After Investments - Operating Income Before Investments) / Incremental Invested Capital
ROIIC example
Consider Jones Automotive, with the following figures:
- Operating Income Before Investments: $5 million
- Operating Income After Investments: $7 million
- Capital Deployed for Incremental Investments: $20 million
Incremental Operating Income: $7M - $5M = $2 million
ROIIC: $2M / $20M = 0.10, or 10%
At 10%, Jones Automotive earns ten cents for every dollar of new capital deployed. Whether that's a strong result depends on the company's cost of capital, its industry, and current market conditions. The number only becomes meaningful in context.
What is a good ROIIC?
There is no universal benchmark. A strong ROIIC in one industry may signal underperformance in another. The factors that shape the answer include:
- Industry norms: Capital-intensive industries typically operate at lower ratios than asset-light businesses
- Company size and stage: Earlier-stage companies investing in growth may show lower ROIIC before returns materialize
- Risk profile: Higher-risk investments carry a higher expected return threshold
- Market conditions: What looked strong in one cycle may not hold in the next
The clearest signal: if your ROIIC consistently exceeds your cost of capital, new investments are creating value. If it falls below, capital is being deployed less efficiently than the business requires.
How to use ROIIC effectively
ROIIC is most useful as a decision-making tool, not just a reporting number. Once you have the result, it should answer a specific question: does this investment deserve more capital, or should resources go elsewhere?
Practical ways to use ROIIC:
- Prioritize investments: Compare ROIIC across projects to focus capital where returns are highest
- Allocate resources: Use the metric to justify or challenge budget decisions with a consistent, comparable figure
- Set performance expectations: Tie investment approvals to a minimum ROIIC threshold aligned with your cost of capital
- Track over time: Run the calculation quarterly or annually to see whether returns are improving, holding steady, or declining
- Evaluate capital strategy: Recurring low ROIIC is a signal to revisit the types of investments the business is making
The goal is not to calculate ROIIC once and file it away. Leaders who track it consistently spend less time guessing and more time making calls they can defend with numbers.
Create custom dashboards for you and your team.
Get started with KlipsTracking Return on Incremental Invested Capital
Tracking ROIIC over multiple periods reveals patterns that a single calculation cannot. A line graph works well for showing directional trends across quarters or years. A bar graph makes period-over-period comparisons easy to read at a glance.
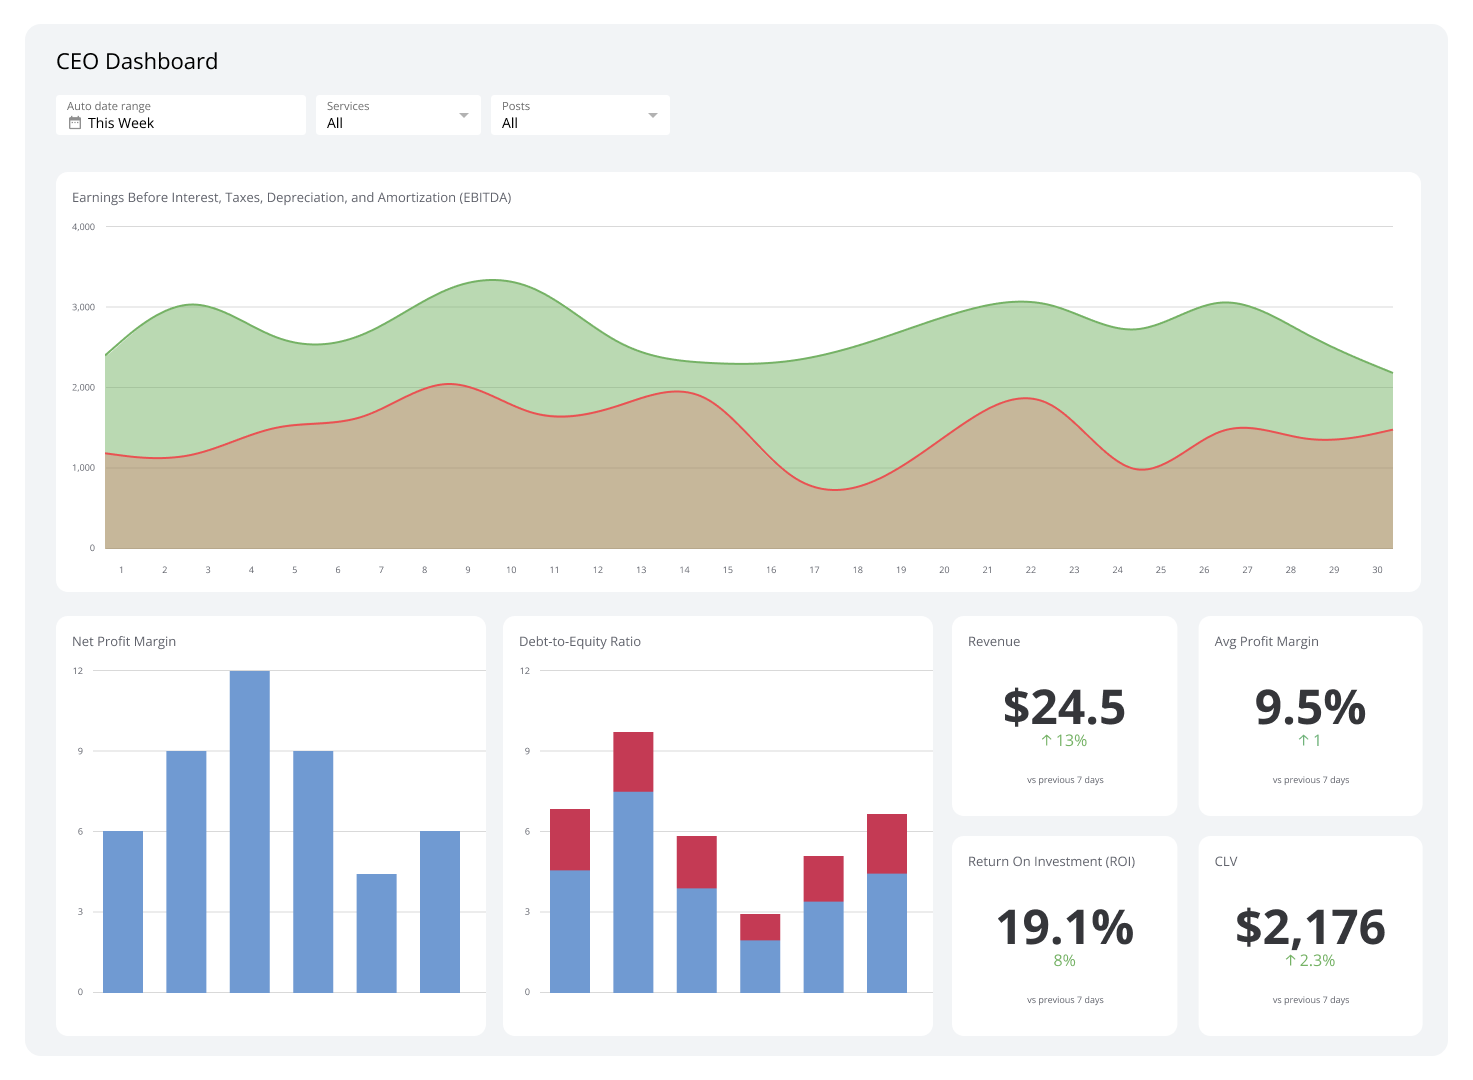
For teams managing multiple investments or business units, a dashboard brings everything into one place. Rather than pulling numbers from separate reports each time a decision comes up, a well-built dashboard surfaces ROIIC alongside related financial metrics automatically. You see what changed, when it changed, and where to look next, without waiting for someone to compile the data.
Klips connects to your financial data sources and lets you build dashboards that keep ROIIC and related metrics current, so the number is there when you need it, not just when someone has time to pull it.