Starter Guide to HubSpot Analytics
Lifecycle, pipeline, email, web analytics, workflows, custom properties. If you’re a HubSpot user, these might be familiar terms. HubSpot is the place where marketers, sales and operations leaders, and customer success teams meet to access the data that drives better business decisions.
Track all your HubSpot Analytics KPIs in one place
Sign up for free and start making decisions for your business with confidence.

In this Starter Guide to HubSpot Analytics, we'll cover:
- What is HubSpot analytics?
- How can a HubSpot analytics dashboard help me reach my goals?
- The digital marketing and reporting statistics that everyone needs to know
- The top HubSpot metrics you should be measuring
- Additional HubSpot resources to help you reach your goals
What is HubSpot Analytics?
HubSpot analytics tracks the most important data from across your business. HubSpot has built-in analytics, dashboard, and reporting functionality. You can access all of your marketing and sales data within HubSpot to discover insights. Marketers, sales and operations leaders, and customer success teams work cross-functionally, and HubSpot analytics can provide a holistic view of the customer lifecycle in order to understand your full business performance.
Let's take a look at the difference between HubSpot's built-in analytics and a third-party HubSpot analytics tool like PowerMetrics.
HubSpot's Built-In Analytics
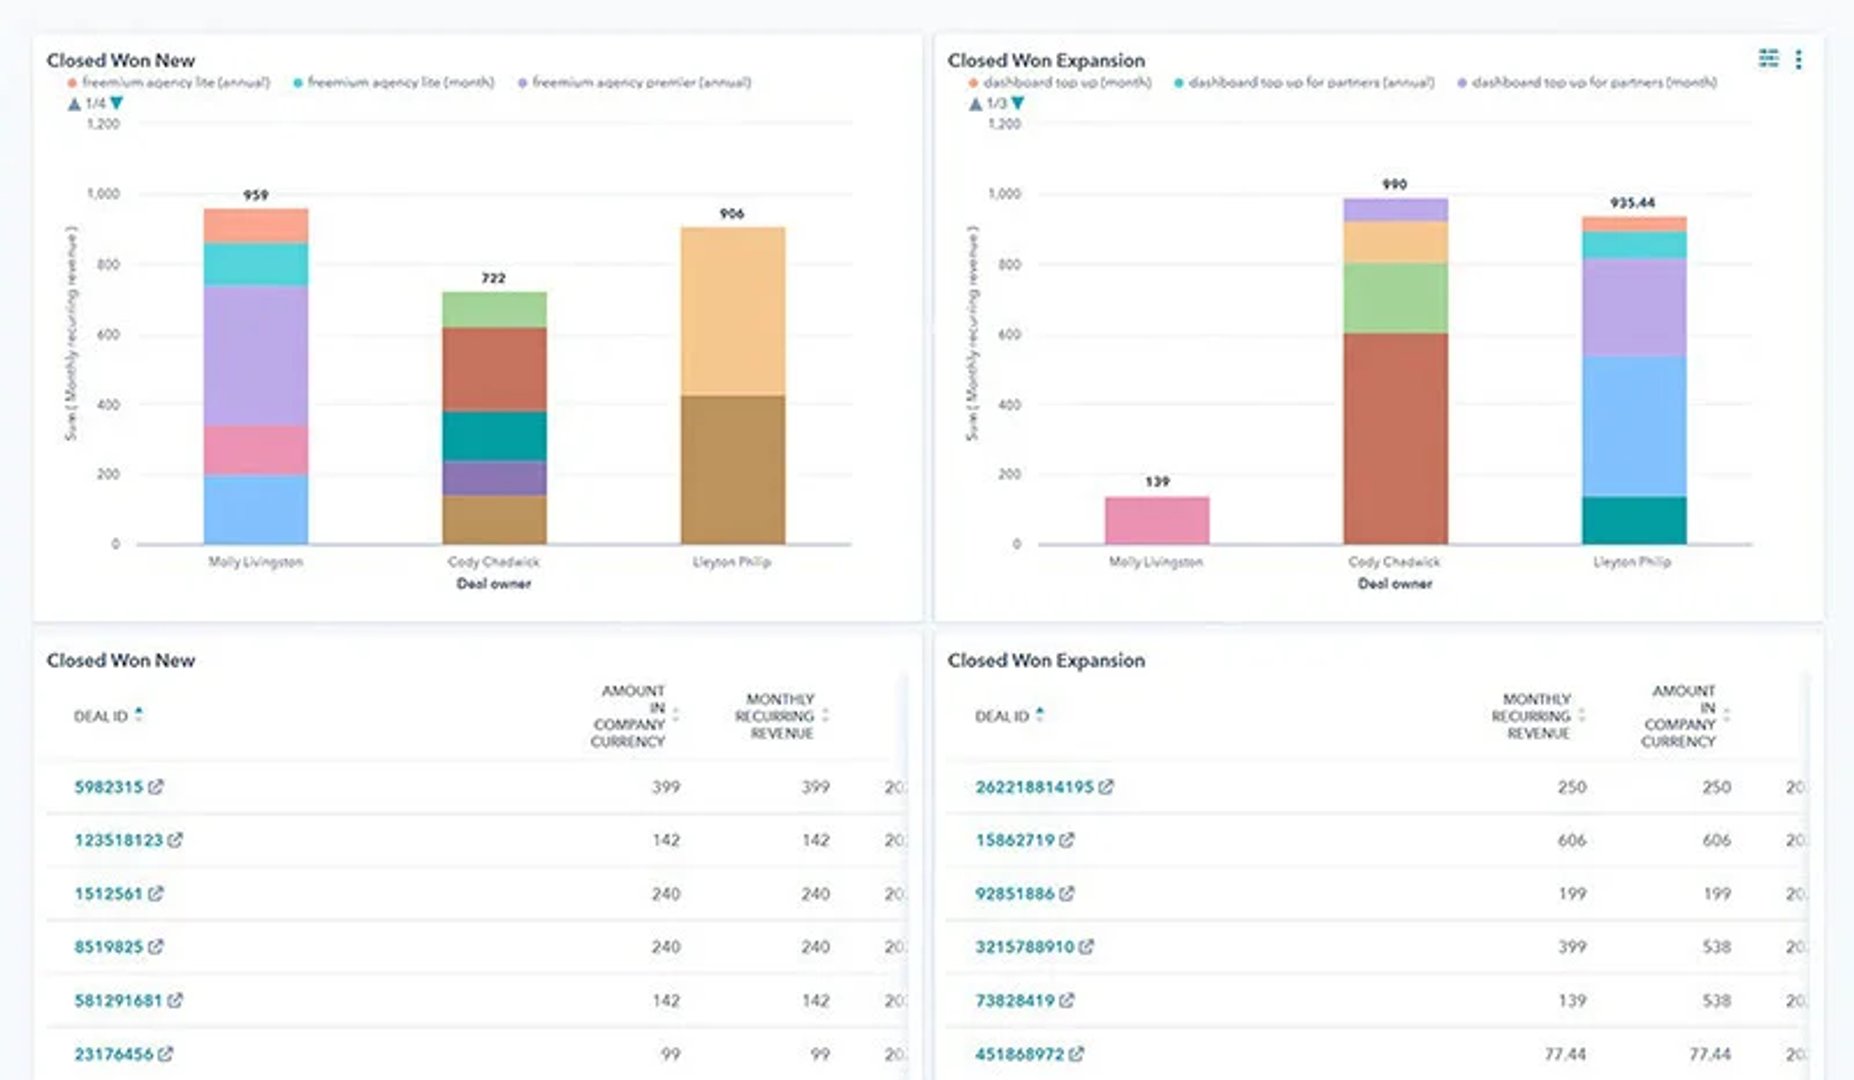
HubSpot provides a default reporting option that you can segment by marketing, sales, and operations. The single data service functionality of HubSpot makes the reports easy to build, but as with anything, there are limitations. HubSpot groups together your reports on a dashboard and displays it using the default data visualization, leaving little to no options for customization or deep dimensional analysis.
The in-app analytics functionality can also make it challenging to share insights with stakeholders who aren't HubSpot users. And HubSpot's in-app analytics is also limited to just that—HubSpot data. When you pull your data into a third-party tool like PowerMetrics, you can combine and compare your HubSpot data alongside data services like Google Analytics, Salesforce, QuickBooks, Facebook or LinkedIn.
Types of reporting and the metrics you can track in HubSpot
Traffic analytics
Traffic analytics analyzes your website traffic so you can better understand where your visitors are coming from and which pages perform best. Within the traffic analytics report, you can access your conversion rate, new customers, and page views metrics.
Website analytics
The website analytics report is a more in-depth analysis of your website performance. The metrics available within this report include page views, bounce rate, and average time on page. You can segment the website analytics by page type, including landing pages, website pages, or blog posts.
Email analytics
Email analytics in HubSpot offers basic performance metrics like open rate, click-rate and click-through rate, and bounce rates. While the email reporting doesn't offer dimensionality or segmentation, you can use the compare email functionality to compare trends in your email performance.
Sales analytics
HubSpot offers a few different reports to track the performance of your sales team, including a pipeline report that allows you to track which stage each opportunity is at and forecast deal amounts. You can break each metric out into its own report, too, including number of contacts, lifecycle stage, revenue, average deal size, and customer acquisition cost.

Third-party HubSpot Analytics Tools
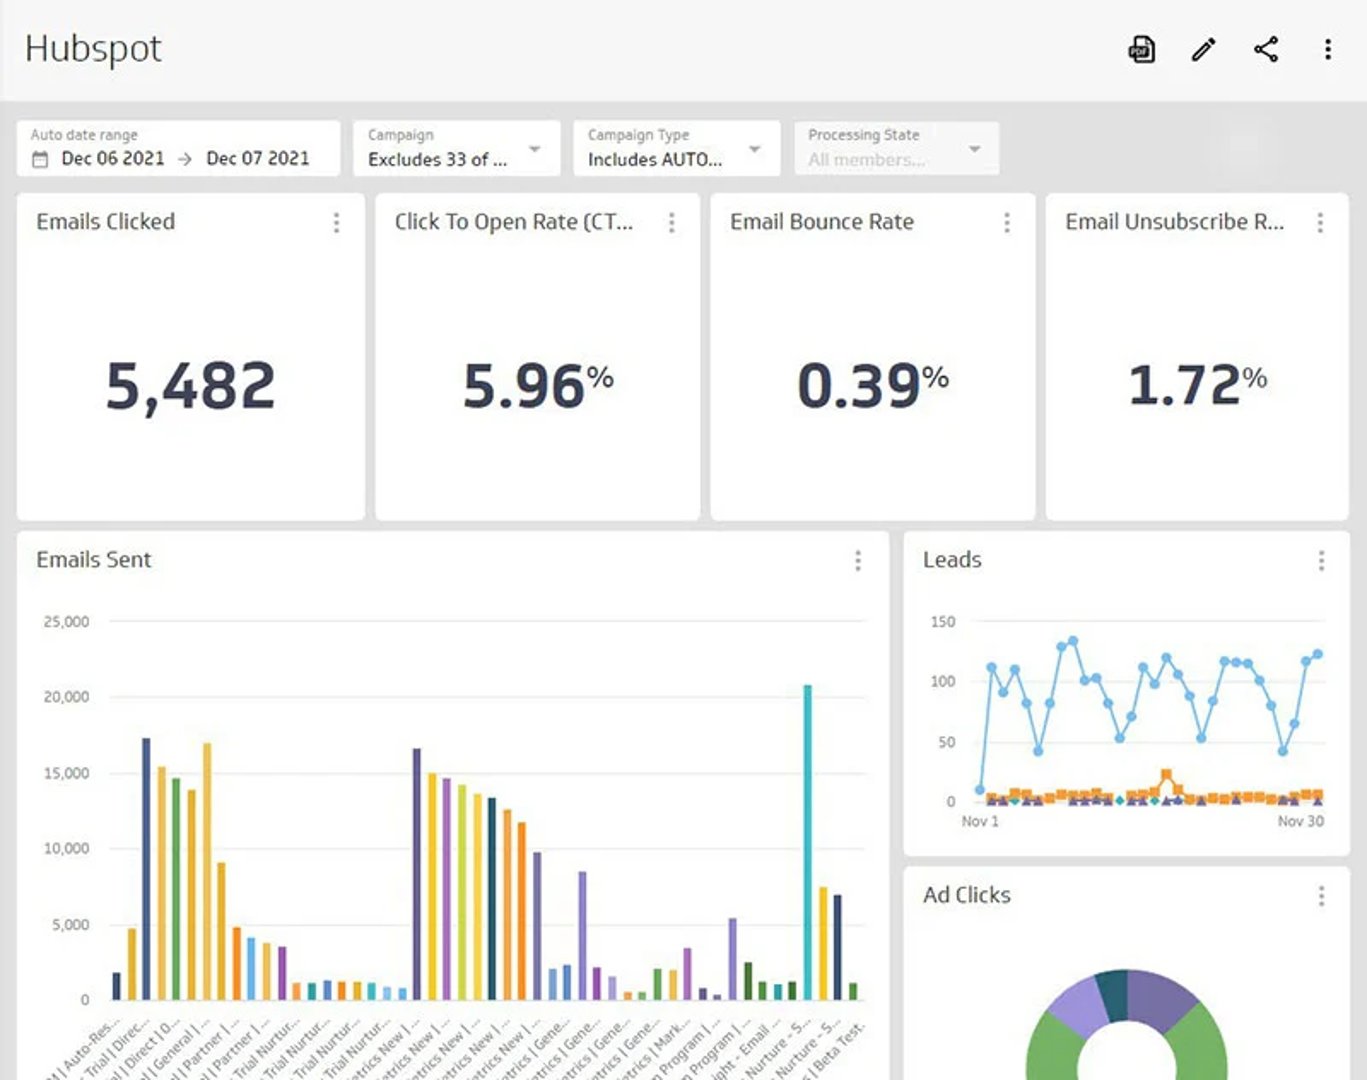
PowerMetrics allows you to define your operations approach with elevated reporting capabilities. PowerMetrics gives you the power and flexibility to build a dashboard with data visualizations that you can slice and dice to give you deep insights and access the right data at the right time.
The real benefit of using a third-party analytics tool is that it allows you to integrate your HubSpot data with additional data services, so you can take a deep and sophisticated approach to your analysis. With a third-party analytics tool, you can combine your HubSpot data with your financial data from QuickBooks, your web analytics from Google Analytics, and your ad spend from Facebook Ads to give you a holistic view of your organizational performance. Bring all of that data together into PowerMetrics to create a dashboard will update in real time, so you can always access up-to-date insights.
PowerMetrics also stores your historical data. So, when year-end comes around and it’s time to report on the last 12 months, you can present the end vision and have the data to back up how you got there.

How can a HubSpot analytics dashboard help me reach my goals?
- Connect your HubSpot data with instant metrics, custom metrics, or calculated metrics. Bring in your HubSpot data in a way that works for you so you can get the insights that will help you make better business decisions.
- Combine your HubSpot data with complimentary data sources. You don’t have to choose between HubSpot or Google Analytics. A PowerMetrics dashboard marries HubSpot and Google Analytics in one place
- No coding skills required, quick to start, and affordable pricing that scales with you as your data needs grow.