World-Class SaaS Support: The Metrics You Need to Track

Published 2023-03-21
Summary - Delivering world-class SaaS support requires a comprehensive approach. Learn which metrics matter!
Delivering world-class SaaS support requires a comprehensive approach. If your organization is going to deliver what your clients need when they need it, it’s critical to stay on top of your service, and the quality being provided to your customers—and to do all of this with a reasonable allocation of resources.
This can only happen if you examine the data at every level of your organization. However, it is difficult to know which metrics and data are relevant to track. With this white paper, we aim to provide you with a definitive and comprehensive list of the metrics to track for chat support. Each section offers a new set of metrics that you can use to augment and enhance your insights. We have used a Klipfolio dashboard system that presents data from the Salesforce Live Agent chat environment an example in the report.
By implementing these metrics within your organization, you and you team will be able to build a solid foundation for improving the success of your customer service department.
Introduction to SaaS Support Metrics
Most SaaS companies eventually encounter a problem with churn. Churn is what happens when an initially-enthusiastic customer loses interest and confidence that the software will deliver the desired results. If a customer loses confidence in your support capabilities, they will eventually stop using your software and could begin to explore competitors’ products.
Research shows that 5-7% of annual customer churn is an acceptable rate for a business. The same study shows that 70% of SaaS providers are operating at a much higher churn rate, which represents a huge revenue loss for those SaaS providers.
Not only is this startling statistic damaging to the providers involved, it’s damaging to the industry as a whole. These numbers represent a significant influx of businesses in the SaaS market who do not value customer experience.
We can do better than this.
We can stay on top of our customer experiences. We can provide ongoing, high-level support in a way that our users find valuable. But that support has to come from somewhere; first we need a solid handle on the basics. We need to know which facets of our service are working well for our customers, and which need to be adjusted. We need to know precisely where customer service and support battles are being won, and where they are being lost.
These are the metrics you need to keep track of as you develop your ability to deliver truly world-class SaaS support for your customers and clients. Establishing these metrics early on will not only help you set up stronger customer service processes, but will also help your team make adjustments and improve quickly.
Identifying Pain Points
So, why is customer churn so high in SaaS companies? A report published by Chargify identifies some of the primary factors that drive customers and clients to look elsewhere after an initial purchase:
- Poor support for initial goal achievement: How quickly was the client able to resolve the issue that brought them to your product in the first place? If they are unable to come to a quick initial resolution, they may be unlikely to use your product again in the future.
- Poor support follow-up: SaaS products are inherently designed to provide ongoing solutions, which means that ongoing support is required to ensure goal-completion rates remain high. Without active follow-up, you miss out on valuable opportunities to ensure client satisfaction.
- More attractive offers from competitors: This may seem like it is beyond your control, but by improving your service quality, you can become more attractive to potential clients than your competitors, and more likely to retain current customers.
- Losing key clients: Some clients are more influential than others. If these key clients abandon your service, others may follow their lead.
- Inadequate product features: It’s no secret that a poor product will drive customers away. By gathering information and continually developing your service strategies, you can be proactive about avoiding a poor service/product model.
- Inappropriate service and support: Different support styles will work for different clients. By getting to know your clients better, you can tailor the support you offer directly to them.
Key Solutions
You might have noticed a common theme in the pain points listed above: gaining knowledge through data. Without solid background knowledge—both of the efficacy of our SaaS products and of the specific situations of our clients—we cannot succeed in retaining customers, or trying to grow a healthy client base.
So, where does the data come from? How can you gather the information you need in order to plan your next moves within the market, and within your company? In short, this data comes from measuring customer interaction, and interpreting those interactions.
In the following section you will find a comprehensive list of the metrics you need to keep track of, specifically dealing with chat support. These metrics can be applied to phone support as well. The metrics are divided into key sections, which will enable your business to track data on five levels: agent, team, management, client, and overall business impact.
The objective is to give you the tools you need to acquire the necessary information and to help you to implement robust, data-driven service protocols within your organization. At the end of the section we have also provided some example dashboards that we have built using Klipfolio that you can set up on each level to make it easier for the observer to consume the data quickly.
The Metrics
Agent Level:
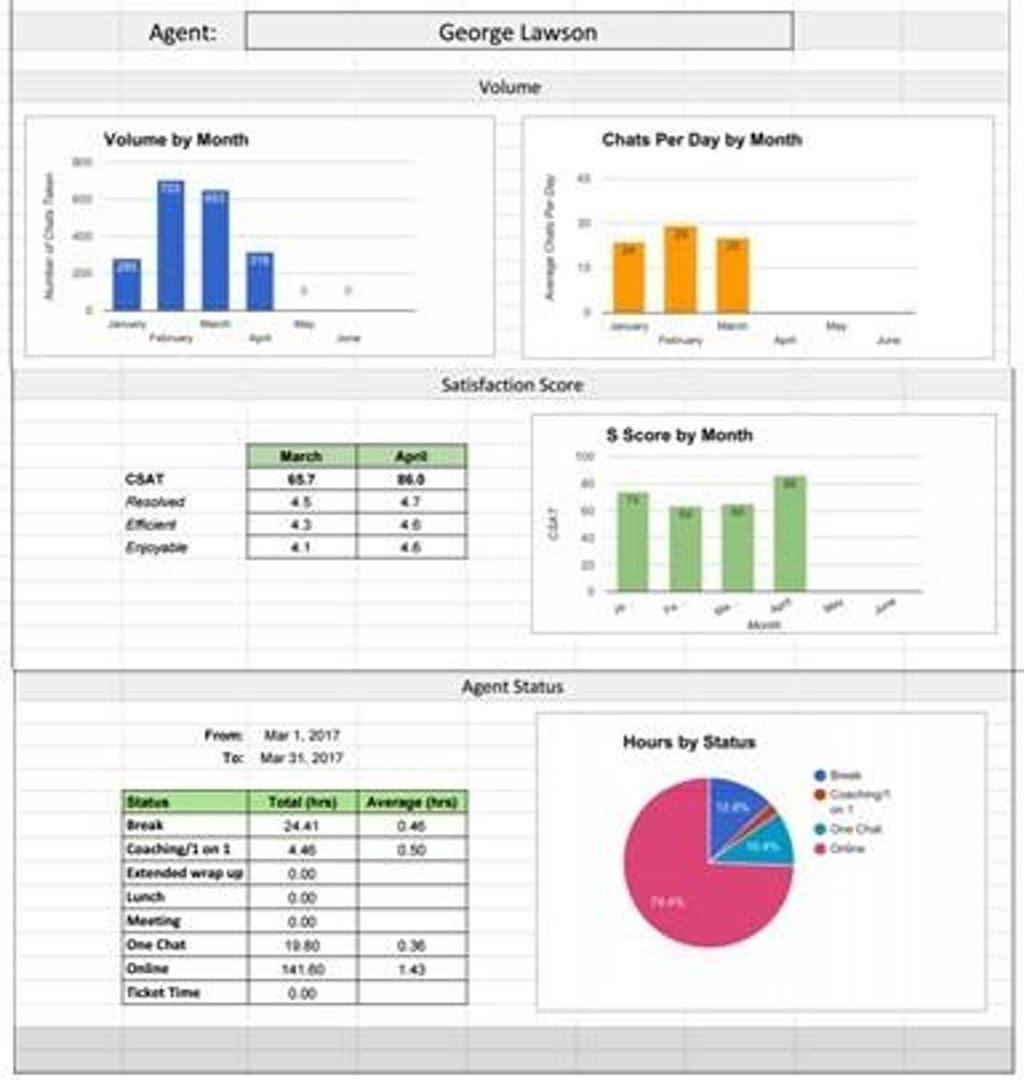
Here are metrics that are viewed by each agent. This only includes data that the agent is responsible for, and that he or she has some control over.
| METRIC | DESCRIPTION |
|---|---|
| Chats Completed | Number of chats taken by agent |
| Customer Satisfaction Score | Score provided by clients based on survey sent after the chat |
| Internal QA Score | Score given by internal quality staff for chats taken by agent |
| Handle Time | Average time spent on each chat |
| Open Tickets | Number of open tickets initiated by agent |
| Ticket Open Time | Average number of days ticket has been opened by agent |

Team Level:
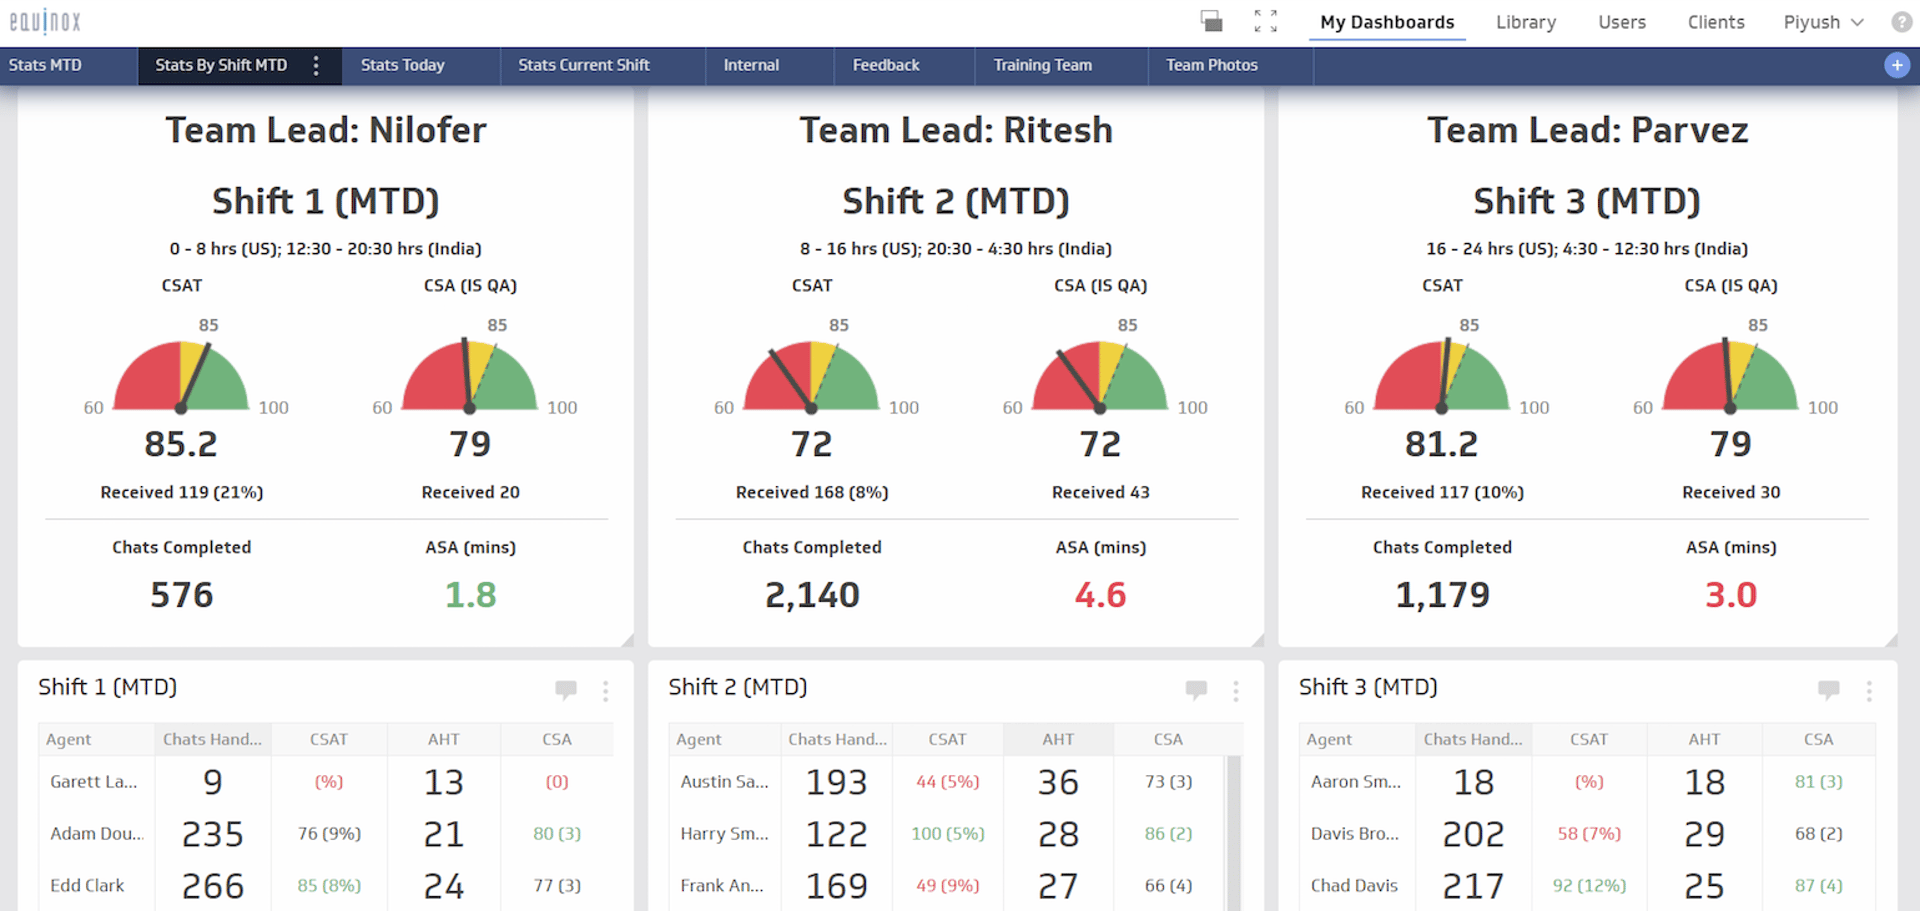
In most SaaS companies, we can assume that one team leader manages about 7 to 10 agents. These metrics are viewed by the team leader, and includes data that he or she is responsible for and exercises some control over.
| METRIC | DESCRIPTION |
|---|---|
| Chats per Hour | Number of chats per hour, by agent |
| Handle Time for Team | Average time spent on each chat, across all agents and by agent |
| Utilization | Average % of time the agents are online |
| Customer Satisfaction Score | Score provided by clients based on survey sent after the chat |
| Current Queue | Number of clients currently waiting in queue |
| Highest Wait Time | Longest time a client has to wait |
| Agents Available | Number of agents online and available |
| Agents Away | Number of agents online but away |
| New Tickets Created | Number of new tickets created that day |
| Tickets Still to be Closed | Number of open tickets |
| Average Response Time | Average time it takes to respond to tickets |
| Average First Reply Time | % of questions that are answered on first request by client |
| Chat Quality Score | Score given by internal quality staff for chats taken by agent |
| Agent Usage by Status | % of time spent by each agent online, in meetings, coaching, and on breaks |

Management Level:
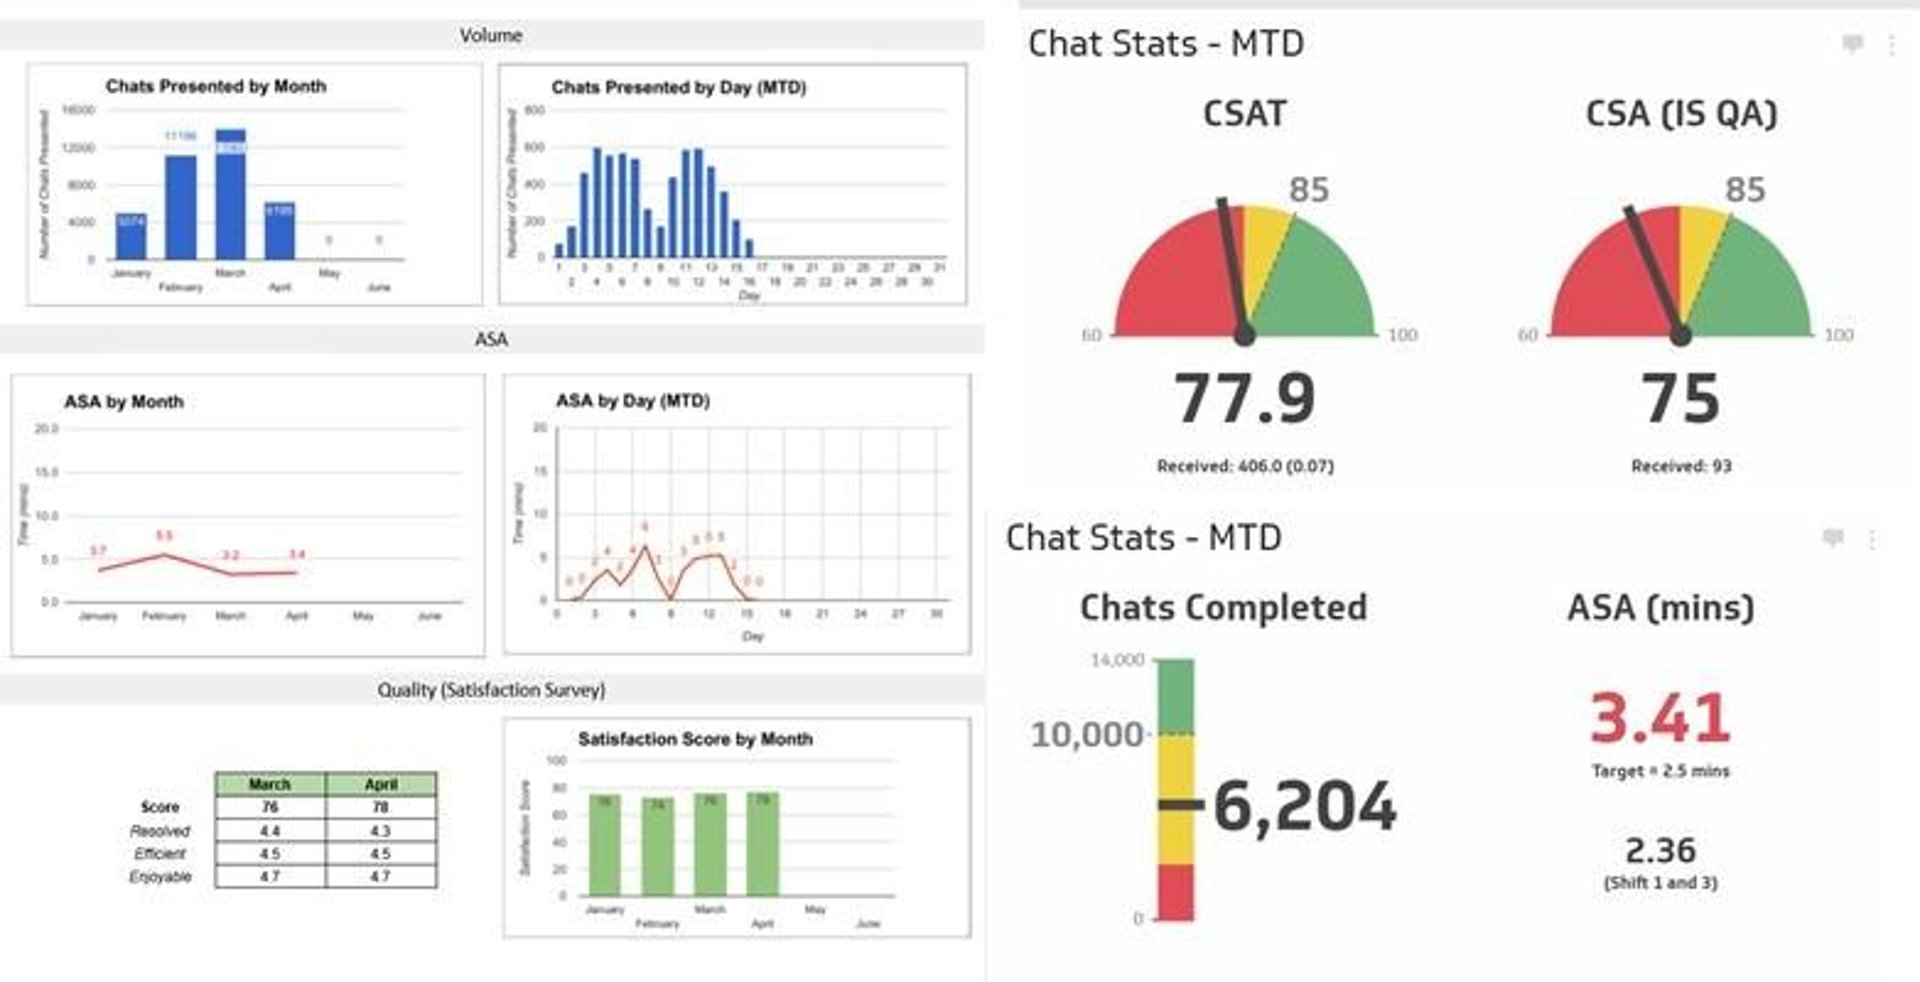
These are that metrics that are viewed on the management level (operations manager, director of customer success, VP of customer success, etc). This data is compiled and shared with management on a weekly or monthly basis as part of the regular management cadence. Some of this data would be combined with other metrics relevant to managing the entire support system.
| METRIC | DESCRIPTION |
|---|---|
| Chats Presented | The total volume of chats, by month, for the last 6 months |
| Average Speed of Answer | The average speed of answer, by month, for the last 6 months |
| Customer Satisfaction Scores | The average customer satisfaction score, by month, for the past 6 months |
| Handle Time for Team | The average time spent on each chat across all agents for the past 6 months |
| $/Chat | The total expense (direct and overhead) for the chat department divided by the number of chats. Show this data for each month for the past 6 months. This is the only metric that matches financial data and performance data and is useful to track resource efficiency |

Client Level:
In addition to the basic metrics shown above, you may also be interested in getting customer-specific data to identify trends. Managers may be interested in reviewing the following on a weekly basis:
- Which clients have used the chat more than three times in a month?
- Which clients have submitted more than three low customer satisfaction scores (detractors) in the last 60 days?
- Which clients have given more than three high customer satisfaction scores (promoters) in the last 60 days?
- Which questions were asked most frequently this month?
- What were the top five reasons customers sought support?
- What are the trending topics for each month?
- Which clients are using chat support the most frequently?
- When has proactive support been offered (reaching out to clients, etc)?
Managers may want to personally follow up with some of these clients to thank them for using support and resolve any issues they may have.
Business-Impact Level:
Finally, your business’s decision-makers may want to keep track of the following metrics to make better choices regarding adjusting support resources:
- Average total lifetime value for clients using chats
- Average health score for clients using chats
Conclusion
Building a data-driven culture takes time and commitment. When we apply a set of metrics to a particular problem, or to a particular customer interaction, we can expect a more thorough and effective resolution.
So, what comes next? It will depend on how many of these metrics are already being tracked in your organization, but it begins with developing a data-driven culture from the top down. Growth and scale in the SaaS provision industry can only come from such a culture.
We recommend sharing this list with your in-house data team so that they can put together a blueprint of metrics that make sense for your individual business. The blueprint should consist of the metrics themselves, how they would be gathered from your existing systems, how often they would be gathered, and how they would be displayed to each level in the organization.
Ultimately, it boils down to providing high quality support for a reasonable investment in the eyes of your client. The metrics above will allow you to measure these elements and help every member of your support team see how they directly impact these numbers.
With this metrics infrastructure in place, world-class SaaS support delivery doesn’t seem like such a lofty goal—it becomes your company’s new reality.
-
About Piyush Parikh
Do you want to:
- Reduce client churn by providing higher quality customer service?
- Improve your Customer Satisfaction scores across the entire lifecycle of your customer success path?
- Increase your coverage of customer service so you can provide 24/7/365, high-quality support to your agents?
My focus over the last 10 years has been in building teams to provide technical support to clients across the globe and I have now setup a successful support center that continues to grow quickly. I have worked with customer success leaders in the software industry and understand their challenges dealing with large support volumes - everything from getting and keeping high quality staff to setting up the system for high quality support.
We have written a concise book, that you can read in 30 minutes or less that explains the exact process and how you can use it in your business. You can get your copy here - https://www.equinoxliveagents.com/book
Related Articles

Promoting data literacy with metrichq.org and the power of AI
By Allan Wille, Co-Founder — October 12th, 2023
Secure and accessible dashboards for your extended team
By David Mennie — April 25th, 2023
Unlock Data-Driven Decisions with ChatGPT & MetricHQ
By Nicolas Venne — April 3rd, 2023

