

The ultimate guide to SaaS KPIs and metrics
A comprehensive guide to SaaS KPIs and metrics, covering definitions, best practices, the five fundamental SaaS metrics, stage-specific KPIs for product, growth, and efficiency stages, common KPI mistakes, and how to monitor performance with dashboards and reports.

This is a comprehensive guide to SaaS KPIs and metrics, covering everything from definitions and best practices to stage-specific metrics and common mistakes. Use the table of contents to jump to the section most relevant to where you are right now.

An introduction to KPIs
Running a SaaS business means making decisions constantly, often with incomplete information and real consequences. The leaders who get this right aren't guessing better than everyone else. They know their numbers, they trust them, and they act on them quickly.
That's what KPIs are for.
Decision-making starts with data
The SaaS world moves fast. Products change, teams grow, markets shift. When everything around you is in motion, gut feel becomes unreliable. Data gives you something fixed to stand on.
The goal isn't to measure everything. It's to measure the right things consistently, so you can make confident calls without having to piece together the picture from scratch every time. When your numbers are reliable and always in front of you, decisions get faster and cleaner.
What is a KPI?
A KPI (key performance indicator) is a measurable value that shows how effectively a company is achieving its key business objectives.
The key performance indicators definition applies at every level of an organization. High-level KPIs reflect overall company performance. Lower-level KPIs track progress within specific departments, such as sales, marketing, finance, or call centers.
Types of KPIs
Different departments measure success differently. A sales team tracks pipeline conversion; a support team tracks resolution time. The right KPI type depends on the goal it's meant to serve.
What makes a KPI effective?
A KPI is only as valuable as the action it inspires. Too often, organizations adopt industry-standard KPIs without asking whether those metrics reflect their actual business, and then wonder why nothing changes.
KPIs are a form of communication. Succinct, clear, and relevant information gets acted on. Vague or bloated KPIs get ignored.
Start by getting clear on your organizational objectives, how you plan to achieve them, and who has the authority to act on the information. Bring in feedback from analysts, department heads, and managers. That process will surface which metrics actually matter and who needs to see them.
Being SMART about your KPIs
One reliable way to evaluate a KPI is the SMART framework. A strong KPI is:
Specific: Is the objective clearly defined?
Measurable: Can you track progress toward it?
Attainable: Is the target realistic?
Relevant: Does it connect to your organizational goals?
Time-bound: Is there a clear deadline or timeframe?
SMART examples:
A customer success team member could have a SMART KPI of 20 onboarding calls per quarter or $2,000 new MRR per month.
A front-end developer could have a SMART KPI of contributing at least five improvements to the design system backlog or resolving at least five front-end bugs per sprint.
A digital marketer could have a SMART KPI of 90 referral trials per quarter or five new guest posts per quarter.
"Not everything that can be counted counts, and not everything that counts can be counted." — Albert Einstein
!KPI Lesson 2
How to define your organization's KPIs
Understanding what a KPI is? Check.
What makes a KPI effective? Check.
How to be SMART about KPIs? Check.
Now the harder question: how do you define KPIs that are specific to your SaaS business and where you're trying to go?
What analytics experts say
Before getting into the mechanics, here's how four practitioners think about it:
"Number one way to getting actionable KPIs is starting with the end objective in mind and backing out what metrics accomplish this from there." — Adam Singer, Google
"Less is more. You really only want a few KPIs, as the more you have, the harder it becomes to know what you should pay attention to and what's just noise." — Alex Clemmons, Cardinal Path
"Dig deep, dig deeper, then filter it to find what will make each team most successful." — Anna Lewis, Polka Dot Data
"Before getting to KPIs, you need to back all the way up to the 'why' for your business and determine what the most important questions are that you need to answer." — Caleb Whitmore, Analytics Pros
How to define your KPIs
SaaS leaders often feel pressure to measure everything: the startup metrics they've relied on for years (daily active users, net revenue retention) alongside the growth metrics (monthly MRR growth, churn rate) they need to scale. That pile-on becomes overwhelming quickly.
Another common trap is jumping too far ahead, measuring efficiency metrics like Gross Margin and CLV:CAC before the business has the growth foundation to make those numbers meaningful. (Those metrics are covered in detail in the next section.)
The principle is straightforward: focus on the KPIs that will get you where you want to be, not the ones that simply confirm where you already are.
Step 1: Identify your organization's most important objectives.
Step 2: Choose KPIs that are fixed and capable of forecasting.
Breaking it down: fixed and forecasted
At Klipfolio, we've been thinking about KPIs for over a decade. Here's the definition we keep coming back to:
A key performance indicator is a measurable value that demonstrates how effectively a company is achieving key business objectives.
For a KPI to be useful, it needs to be fixed and forecastable.
Fixed means there's continuity in what you're measuring. An outcome at one point in time can be reliably compared to an outcome at another. For example, if 1 in every 100 trial users converted to a paying customer in both January and February, that's a fixed metric worth building a KPI around.
Forecastable means the KPI helps you anticipate what's coming. If you notice that trial-to-customer conversion accelerates when your Net Promoter Score crosses a certain threshold, that correlation lets you forecast: better customer success outcomes lead to faster conversions. That's worth tracking.
The goal is numbers you can trust and act on, not a dashboard that requires a call with your analyst to interpret.
!KPI Lesson 3
Best practices for picking the right KPIs for your SaaS company
Data is everywhere. The challenge isn't access; it's focus. Tracking the wrong metrics wastes time and money and can pull a team in the wrong direction. Poorly structured KPIs are just as costly as no KPIs at all.
Here are six strategies to help you separate effective, value-creating KPIs from ones that quietly drain resources.
1. Align KPIs with your strategic objectives
KPIs must be grounded in your company's goals. Business performance is always measured relative to where you're trying to go.
Strong objectives: Reduce customer complaints by 50% over one year, or resolve support tickets within one business day.
Weak objectives: Quadruple revenue in one month, or hold more team coffee chats.
2. Make sure the data is actually obtainable
There's no point selecting a KPI if you can't reliably access the data behind it. Before committing, ask: What data points do I need to measure this? What tools or processes do I need to collect it consistently? If the cost of measurement outweighs the value of the insight, pick a different KPI.
3. Be specific
KPIs should keep everyone moving in the same direction and be specific enough to inform distinct actions. A vague KPI gets interpreted differently by different people, which means it gets actioned differently too. That's the opposite of alignment.
4. Prioritize accuracy
Ask yourself: Does this KPI include all the relevant information? How accurately does it reflect actual business performance? A KPI built on unreliable data gives you false confidence, which is worse than no data at all.
5. Confirm the KPI is actionable
A useful KPI passes two tests. First, can your business actually influence the underlying events? If every variable driving the KPI is outside your control, it can't be actioned. Second, is the KPI presented to the right people, in a format that prompts a decision?
6. Keep KPIs alive
It's easy to hold onto KPIs long after they've stopped serving you. Revisit your KPI set regularly. Ask whether your original reasons for choosing each metric still hold. Has your business changed? Has the market? KPIs should evolve alongside the business they're measuring.
Understanding how and why a particular KPI is "key" to your business is more important than ever in an environment where it's easy to generate metrics faster than you can act on them.
!KPI Lesson 4
The fundamental metrics for a SaaS business
SaaS isn't a transactional model. You're not selling someone a product and moving on. You're building a relationship that renews, and your metrics need to reflect that.
Unlike a retailer that sells a product once and may never see the customer again, a SaaS business runs on recurring relationships. The goal is to retain customers, grow the base, and increase the value of each account over time. These five metrics are how you keep score.
Klipfolio is a SaaS business too. These are the metrics we track:
Number of accounts
Recurring revenue
Recurring revenue growth rate
Churn rate (for both accounts and recurring revenue)
Net recurring revenue retention
Create custom dashboards for you and your team.
Get started with Klips1. Number of accounts
The number of accounts is the count of active customers at any given time.
Number of accounts = existing accounts + new accounts gained - cancellations
Know this number cold. It's the foundation everything else is built on.
2. Recurring revenue
Recurring revenue is the money generated on a predictable basis from active subscriptions. It's reported as either monthly recurring revenue (MRR) or annual recurring revenue (ARR).
Four things can happen to your recurring revenue:
New accounts add MRR
Existing accounts upgrade and pay more
Existing accounts downgrade and pay less
Accounts cancel
Recurring revenue = new MRR + upgrades - downgrades - cancellations
Both accounts and recurring revenue can be viewed as a flow (what changed this period) or a stock (total as of today). You need both perspectives to understand what's actually happening.
3. Recurring revenue growth rate
The recurring revenue growth rate tells you how fast you're growing and what kind of trajectory you're on.
Month-over-month RR growth rate = net RR added in period / total RR at beginning of period
Growth gets harder as you scale. Doubling $50K MRR is a very different challenge from doubling $500K MRR. A commonly cited benchmark for early-stage SaaS companies: triple, triple, triple, double, double over the first five years.
4. Churn rate
Churn is the rate at which you lose customers. In a subscription model, even a small, consistent churn rate compounds quickly as your base grows. Left unchecked, it can reach the point where you're losing customers faster than you're acquiring them.
Account churn rate = number of cancelled accounts in period / total accounts at beginning of period
RR churn rate = value of cancelled RR in period / total RR at beginning of period
Track both. Account churn and revenue churn tell different stories, especially when you have a mix of plan sizes.
5. Net recurring revenue retention
Net recurring revenue retention measures whether your existing customer base is growing in value, even before you add a single new account.
Net revenue retention = (RR at beginning of period + upgrades - downgrades - cancellations) / RR at beginning of period
The best SaaS companies have upgrade revenue that outpaces downgrades and cancellations combined. When that happens, your existing base grows on its own, and new customer acquisition becomes fuel on top of an already-growing fire.
!KPI Lesson 5
SaaS KPIs to focus on at each stage of growth
Paul Graham, co-founder of Y Combinator, put it plainly: "A startup is a company designed to grow fast."
For SaaS companies, that pressure to grow creates a tendency to track every metric at once. The result is noise, not clarity. The smarter approach is to focus on the KPIs that matter most for your current stage.
Klipfolio CEO Allan Wille organizes SaaS KPIs and metrics into three stages: Product, Growth, and Efficiency. Each stage has a primary question to answer, and a metric that answers it best.
Product stage: Net Promoter Score
What to answer: Do customers love this enough to tell others?
Net Promoter Score (NPS) measures how likely your customers are to recommend your product to a colleague or friend. It's based on a single survey question: "On a scale of 0 to 10, how likely are you to recommend us?"
Responses fall into three groups:
9–10: Promoters
7–8: Neutrals
0–6: Detractors
NPS = % Promoters - % Detractors
NPS is a leading indicator. A rising score means you're building something people trust enough to stake their reputation on. That's the foundation for sustainable growth.
Growth stage: the Rule of 40
What to answer: Is this business growing at a healthy rate relative to its profitability?
Brad Feld's Rule of 40 is a quick health check for SaaS companies. Add your revenue growth rate and your profit margin. If the combined figure is 40% or above, the business is in good shape.
Rule of 40 = growth rate + profit margin
A few examples:
Growing at 20% with a 20% profit margin: 40%. Healthy.
Growing at 40% with a 0% profit margin: 40%. Still healthy.
Growing at 50% with a -10% profit margin: 40%. Acceptable, because growth is funding future value.
In SaaS, sacrificing near-term profit for growth is often the right call. The market tends to reward the leader, so investing in growth while you have momentum makes sense.
Efficiency stage: CLV:CAC
What to answer: Are we spending the right amount to acquire customers?
The Customer Lifetime Value to Customer Acquisition Cost ratio (CLV:CAC) tells you whether your acquisition economics are sustainable.
Customer Lifetime Value (CLV) = Gross Margin % × (1 / Monthly Churn) × Average Monthly Revenue per Customer
Cost to Acquire a Customer (CAC) = Sales and Marketing Costs / New Customers Won
An ideal LTV:CAC ratio is 3:1. The value of a customer should be three times the cost of acquiring them. A ratio close to 1:1 means you're spending too much to grow. A ratio of 5:1 or higher often means you're under-investing and leaving growth on the table.
Knowing this number tells you exactly how hard you can push on acquisition before the economics break down.
For more KPI inspiration, check out this list.
Online reviews
Today's SaaS buyers research before they ever contact a vendor. Online customer reviews have become a primary trust signal, with 94% of customers reading reviews before making a decision and 92% of B2B buyers saying reviews influence their purchase.
Online reviews also give SaaS companies a direct channel to demonstrate responsiveness, and they level the playing field between established platforms and newer entrants.
!KPI Lesson 6
Why KPIs fail and common KPI mistakes
You've defined your KPIs, set targets, and briefed the team. That's the easy part. The harder part is making them stick.
KPIs fail more often than most organizations want to admit. Here are the five most common reasons.
Poorly defined KPIs
A well-defined KPI is structured, informed by multiple perspectives, and specific to your business. Cookie-cutter KPIs from a blog post (including this one) are a starting point, not a finish line. Your KPIs need to reflect your actual performance objectives and be recognizable to everyone who's expected to act on them.
The most common failure at the definition stage is building KPIs in isolation, without input from the people closest to the work.
No accountability
Every KPI needs an owner. Someone who is responsible for tracking it, reporting on it, and driving the actions that move it. An unowned KPI drifts. Assign ownership at the point of definition, not as an afterthought.
Unachievable targets
Ambition is good. Unachievable targets are demoralizing. If you're at $5M ARR and you set a KPI to reach $50M this year, you haven't set a KPI. You've set a wish. Anchor targets to a specific timeframe, track progress regularly, and adjust when the business changes.
Targets that are too vague
"Grow faster" is not a KPI. "Reduce churn rate from 4% to 2.5% by Q3" is. Specificity is what makes a target achievable and measurable. Without a clear number and deadline, there's no way to know if you've succeeded.
The KPI is too hard to measure
The most common reason KPIs fail is that the data isn't there to support them. A KPI without reliable data is abstract and unactionable. Before committing to a metric, confirm you can actually collect, clean, and track the underlying data consistently over time.
Common KPI mistakes to avoid
Even strong organizations make these mistakes:
Relying on intuition instead of data, often driven by overconfidence in recent experience
Copying industry benchmarks without adapting them to your specific business context
Recency bias, where the most recent data point gets treated as the whole story
Confusing lagging and leading indicators, tracking outputs (easy to measure) while ignoring inputs (harder to measure but more actionable)
Define your KPIs clearly, assign ownership, set specific targets, and revisit them regularly. They will change as your business evolves, and that's expected. The goal isn't a perfect KPI set on day one. It's a KPI practice that gets sharper over time.
!KPI Lesson 7
Monitor your KPIs with dashboards and reports
You know what to measure, how to define it, and what mistakes to avoid. The last piece is making sure your KPIs are visible, reliable, and always current.
What is KPI software?
KPI software lets businesses create, manage, and track data from multiple KPIs in one place. Instead of pulling numbers from separate tools and pasting them into a spreadsheet (or explaining your business context to an AI from scratch every time you want an answer), KPI software connects your data sources directly and keeps everything current automatically.
The result: your team sees the same numbers, at the same time, without anyone having to chase them down.
Create custom dashboards for you and your team.
Get started with KlipsKPI reports and dashboards
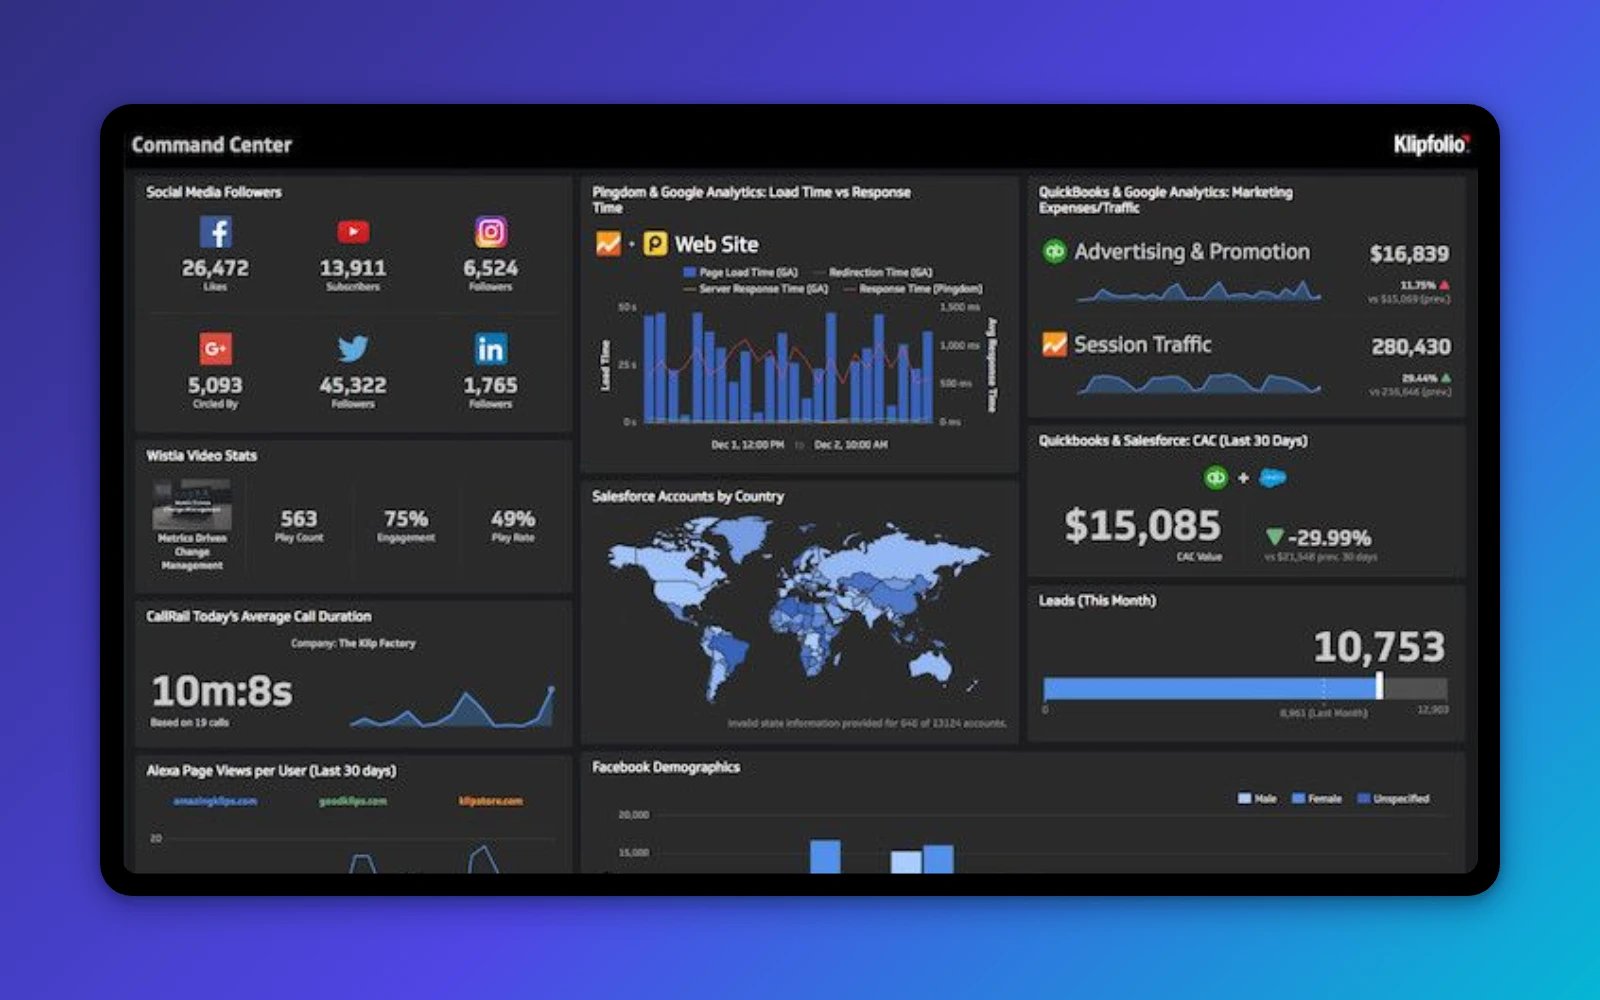
KPIs need to be monitored consistently. If they change in real time, they should be visible in real time. KPI dashboards and reports make that possible, giving leaders a clear view of performance across the business without waiting for someone to pull a report.
Here are live dashboard examples built for SaaS companies:
Building those from scratch takes time. That's why Klipfolio includes pre-built dashboard templates for the most common data sources. Through the Gallery, you can get a working dashboard in minutes, not days.
When your metrics are always current and always accessible, you stop spending time finding numbers and start spending time acting on them. You catch problems earlier, spot what's working faster, and make decisions with confidence rather than hesitation.
That's what a good KPI practice looks like in practice.
Updated 2026-09-09




Most recent
- SEP 25What SOC 2 taught a small team about trust
- SEP 15The AI race: progress, humanity, and trust
- SEP 9The good advisor
- AUG 11Beyond simple sign-ups: how True Trials and Activation predict growth
- JUL 7Why business leaders miss important trends in their dashboards
- JUN 19The best chart for the job: Visualizing data for non-technical users