

Summary - There are two types of metrics-driven businesses: those driving behaviours toward specific metrics, and those using metrics to drive behaviours. This post explores how Versature uses Klipfolio Klips dashboards across Customer Support, Onboarding, and Customer Success to let real-time data shape decisions — so results follow without anyone having to go looking for a number.
The term "metrics-driven business" gets used a lot. It often describes teams that move fast and rely on data to succeed.
There are two types of metrics-driven businesses: those driving behaviours toward specific metrics, and those using metrics to drive behaviours.
For clarity, this post separates the two as: metrics-driven and driven-by-metrics.
The classic example of metrics-driven is setting a sales goal and tracking progress toward it. The sales staff is driving the car; the metric is the destination. You can use Klipfolio Klips for this, but that would be like driving a Ferrari and never taking it out of first gear.
Klipfolio Klips excels at the driven-by-metrics strategy. In this scenario, results come from processes shaped by good data. Instead of driving toward a sales goal and hoping for the best, the data points the team in a direction that makes the sales goal inevitable. Metrics are driving the car and pointing it in the right direction; the team is along for the ride.
Like many Klips customers, Versature has made business dashboards integral to daily operations across Sales and Marketing. What sets Versature apart from the traditional "dashboards on the wall" setup is using Klipfolio Klips on the Client Services side of the office to drive behaviours in real time — without anyone having to go looking for a number.
Dashboards for customer support
At Versature, the team answers every call to the Support line. The service level agreement (SLA) is ambitious by design, built around creating an exceptional client experience. Before using Klipfolio Klips, the team reviewed call centre analytics weekly to determine whether the bar was being met.
Historical data helps, but it does not let teams adapt in the moment or see the live customer experience.
With Klipfolio Klips, the call centre is monitored on a single dashboard visible to the entire team. Alerts trigger when the service level drops below goal, so the team can make adjustments on the fly — no report to pull, no manager to ask.
When an abandoned call occurs (the caller hangs up before the Support Team answers), a bold yellow line chart immediately shows how long the caller waited before giving up. When multiple abandoned calls occur in a day, the team can compare the average wait time to the current week and month.
This approach uses historical data as a benchmark for the current day's service level, while still enabling real-time adjustments when needed. That's just the tip of the service level iceberg.
For a complete view of the client experience, the team tracks service level, abandoned rate, available agents, average hold time, average handle time, and average answer speed on the same dashboard. Since there are multiple call queues (support, billing, sales), the user input control feature lets agents view each queue's stats independently.
A second Support dashboard surfaces relevant case data from Salesforce to flag accounts that need attention. Every new case appears on the dashboard with its age displayed. Using Klips indicators, agents are warned when a new case has been untouched for too long. The same system flags open cases that require follow-up and escalated cases being worked on by the Network Operations Team.
Out of sight, out of mind? Not here.
Dashboards for onboarding
Rolling out new clients is one of the most important parts of any SaaS product. The processes work well, but the management team was spending significant time sifting through separate reports to see how the team was performing overall.
Combining all data into a single dashboard was all it took to confirm that new clients were being onboarded efficiently and without delay. Instead of waiting for a weekly summary, the team knows where things stand.
The average rollout takes about four weeks, which means once the team starts looking at the previous month's sales, the workload forecast for the next month becomes clear. Seeing the monthly progression of newly billed customers increase day in and day out gives the Onboarding team fresh motivation and sparks friendly competition with Sales.
Perhaps the most valuable part of the Onboarding dashboard is its relevance across departments. Senior staff can see how many clients go live each month and the average number of days it took to get them there, while junior agents can focus on the granular activities that need attention.
The Onboarding manager can quickly see how many customers each agent is working with and the value of each account. Combining that view with the current stage of each rollout makes it easier to assign new clients and keep workloads balanced.
The result is a stronger client experience — and a team that operates like a much larger one.
Dashboards for customer success
If a business doesn't have a Customer Success function, churn analytics likely runs high and root causes stay unclear. If there is a Customer Success team but actions are not guided by reliable data, the work becomes reactive firefighting instead of proactive value creation.
The versatility of Klipfolio Klips makes it straightforward to display high-level metrics related to renewals, upsells, and churn alongside granular account activity that highlights red flags or points out growth opportunities. Senior Management, the Team Manager, and Customer Success Managers all get relevant data from multiple sources, displayed in one place — with numbers they can trust.
Here's a sample Klipfolio dashboard using data from Salesforce:
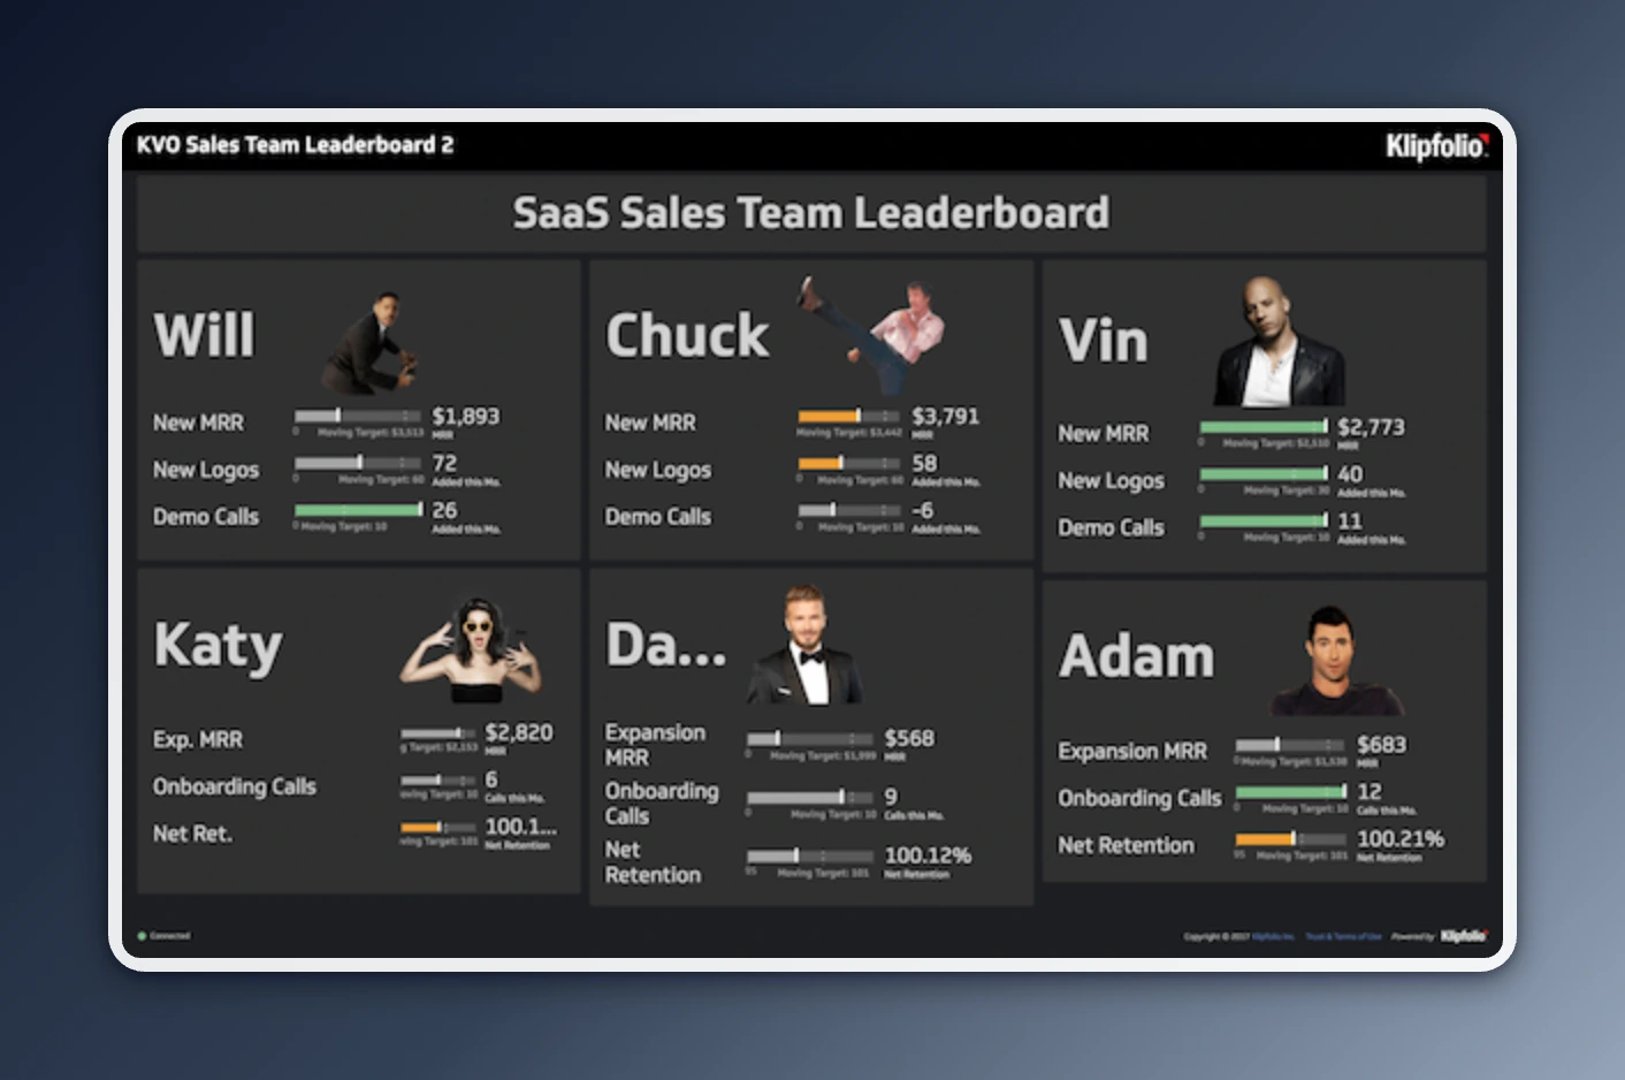
Teams often find that dashboards are useful for shaping behaviours that translate to desired business outcomes, and that sharing accomplishments spreads confidence across the company.
When a member of the Sales team can share a negative churn rate or an average answer speed of 22 seconds with a prospect, it demonstrates the cross-departmental value of these dashboards. On the flip side, if the team is struggling with a specific part of the service, publicizing that struggle on a dashboard gets things moving.
And when Support agents compete to answer calls faster than their peers to boost the SLA percentage, it proves the point: when metrics are driving, results follow.
Tyler Cooper is the Director of Client Services at Versature, a Canadian telecom company that offers industry-leading cloud-based business communication solutions.