Sales Leaderboard Dashboard
Use a sales leaderboard to track performance and motivate your sales team to reach targets.
Track all your Sales Leaderboard KPIs in one place
Sign up for a 14-day free trial and start making decisions for your business with confidence.
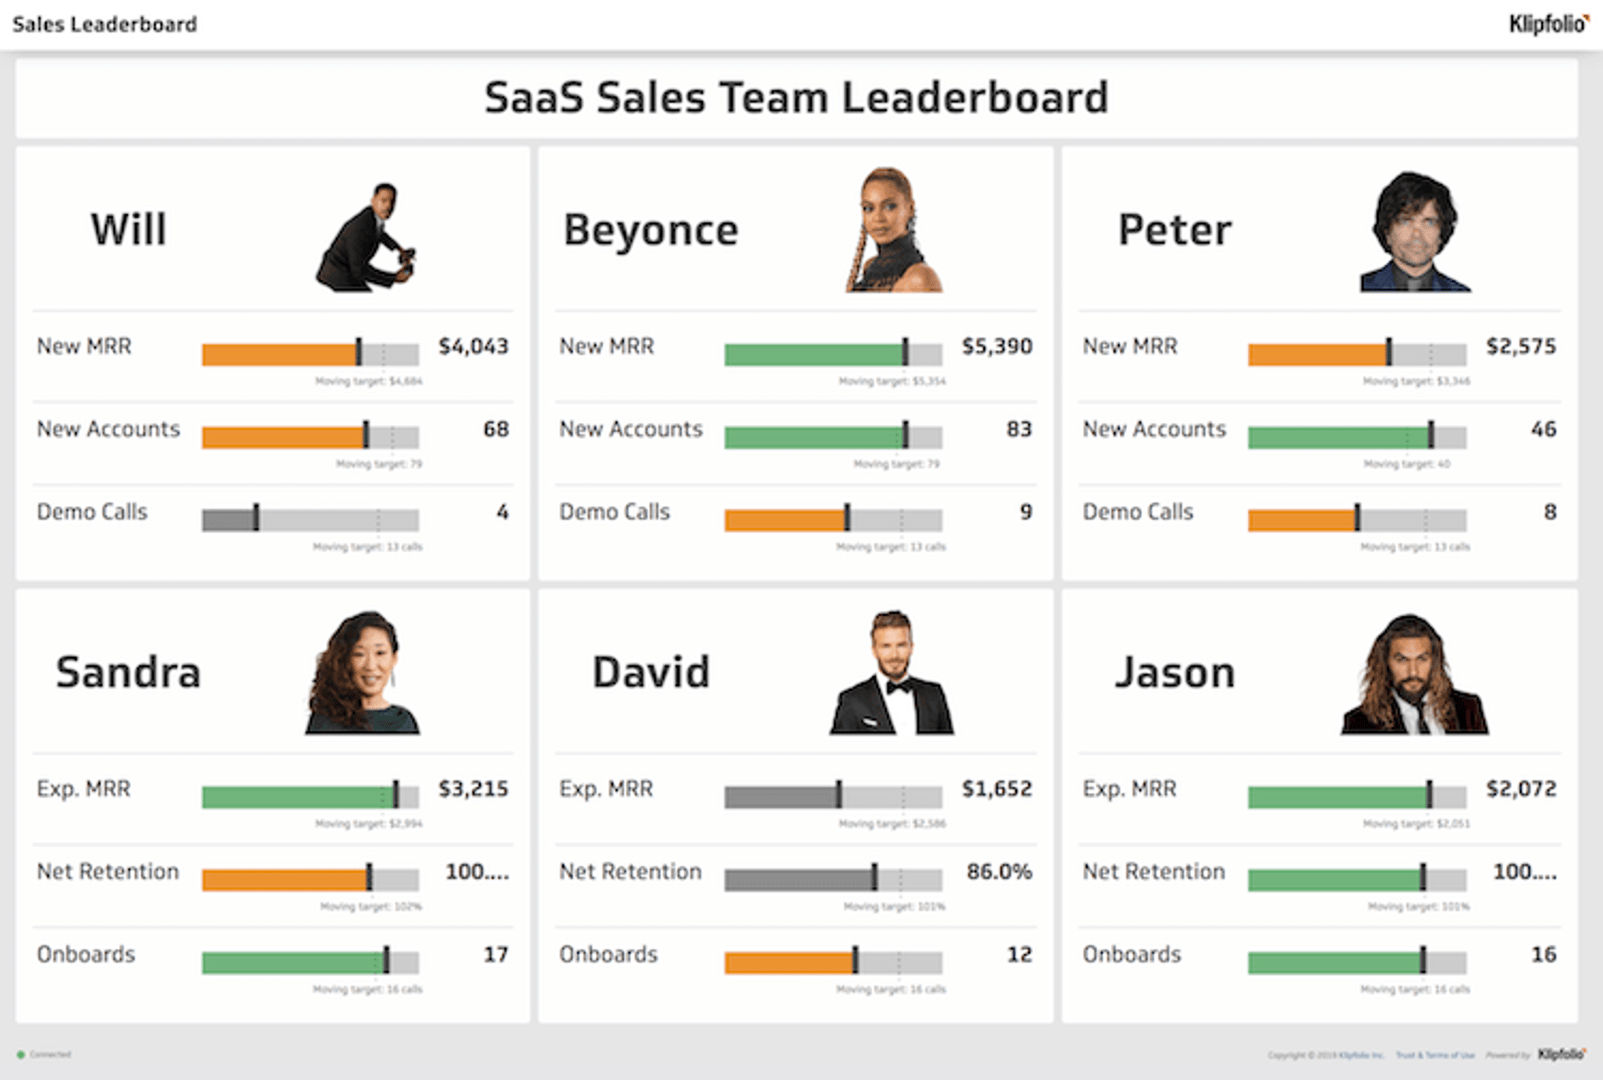
What is a Sales Leaderboard dashboard?
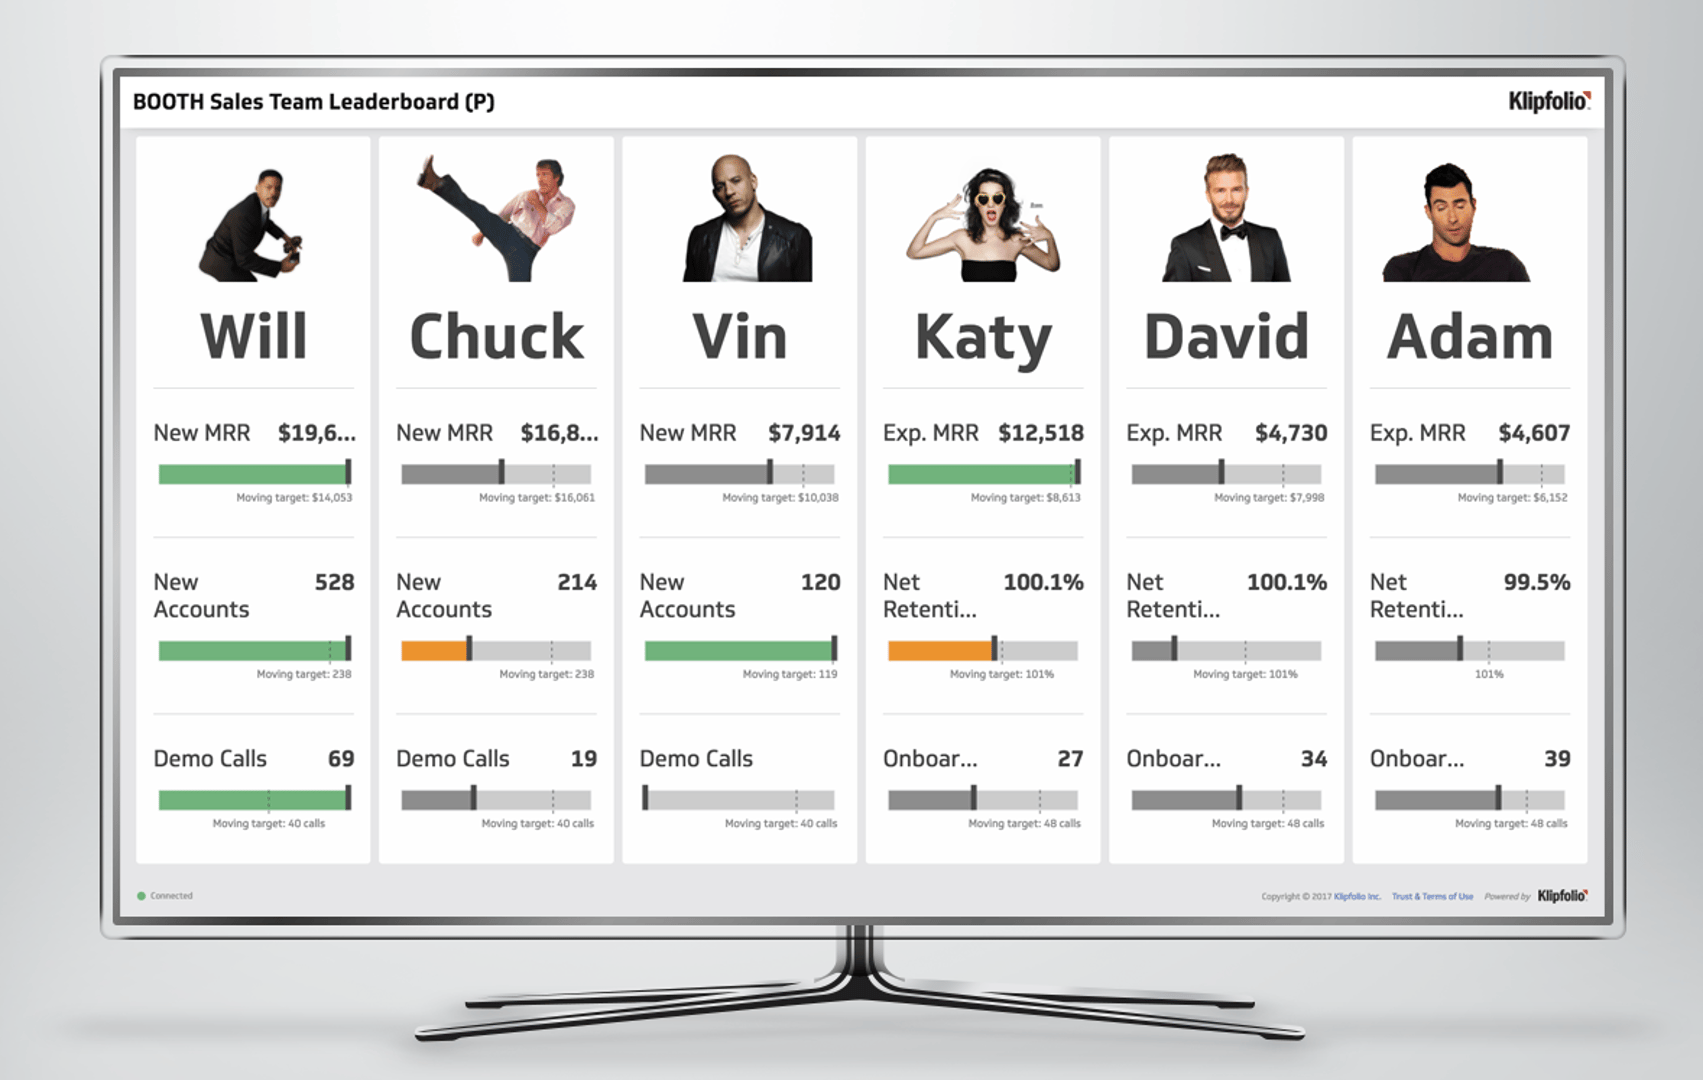
A sales leaderboard is a software application used to track a sales team’s performance against business goals and targets. Sales leaderboards display individual performance side by side, making it easy to see which members of a sales team are ahead of the target or behind the target. A sales leaderboard can be used to track performance on a daily, weekly, or monthly basis, depending on business objectives.
Want to create an open work environment using data? Displaying a sales leaderboard in your office is a great way to motivate employees to hit targets both as individuals and as a team. You can build a sales leaderboard to track performance across multiple sales metrics and KPIs and display that data on a live tv dashboard, making the data available to the entire business.
Why build a sales leaderboard
A sales leaderboard is a great way to incentivize a team and create an open culture. Here are some other benefits of implementing a sales leaderboard:
- Track individual sales performance in real-time
- Track team sales performance in real-time
- Directly compare performance across multiple sales metrics
- Use competition to motivate the sales team
- Create an open work environment using data
- Use the leaderboard data to make quick decisions and not wait for end-of-quarter reports
How to create a sales leaderboard
You can create a sales leaderboard by using real-time data from your CRM (e.g., Salesforce) and charting those metrics with your business targets. Use these steps to build your own sales leaderboard:
- Create a report in your CRM that tracks new business deals, new business values, demo calls, and any other sales KPIs by the sales rep.
- Create an Excel spreadsheet to track your daily, monthly, and quarterly sales targets for each KPI you want to track.
- Use your CRM report and Excel spreadsheet to build data visualizations, such as a gauge, that displays your sales metrics against your business goals.
- Use dashboard software, a tv monitor, and an HDMI device to display your sales leaderboard in your sales department.
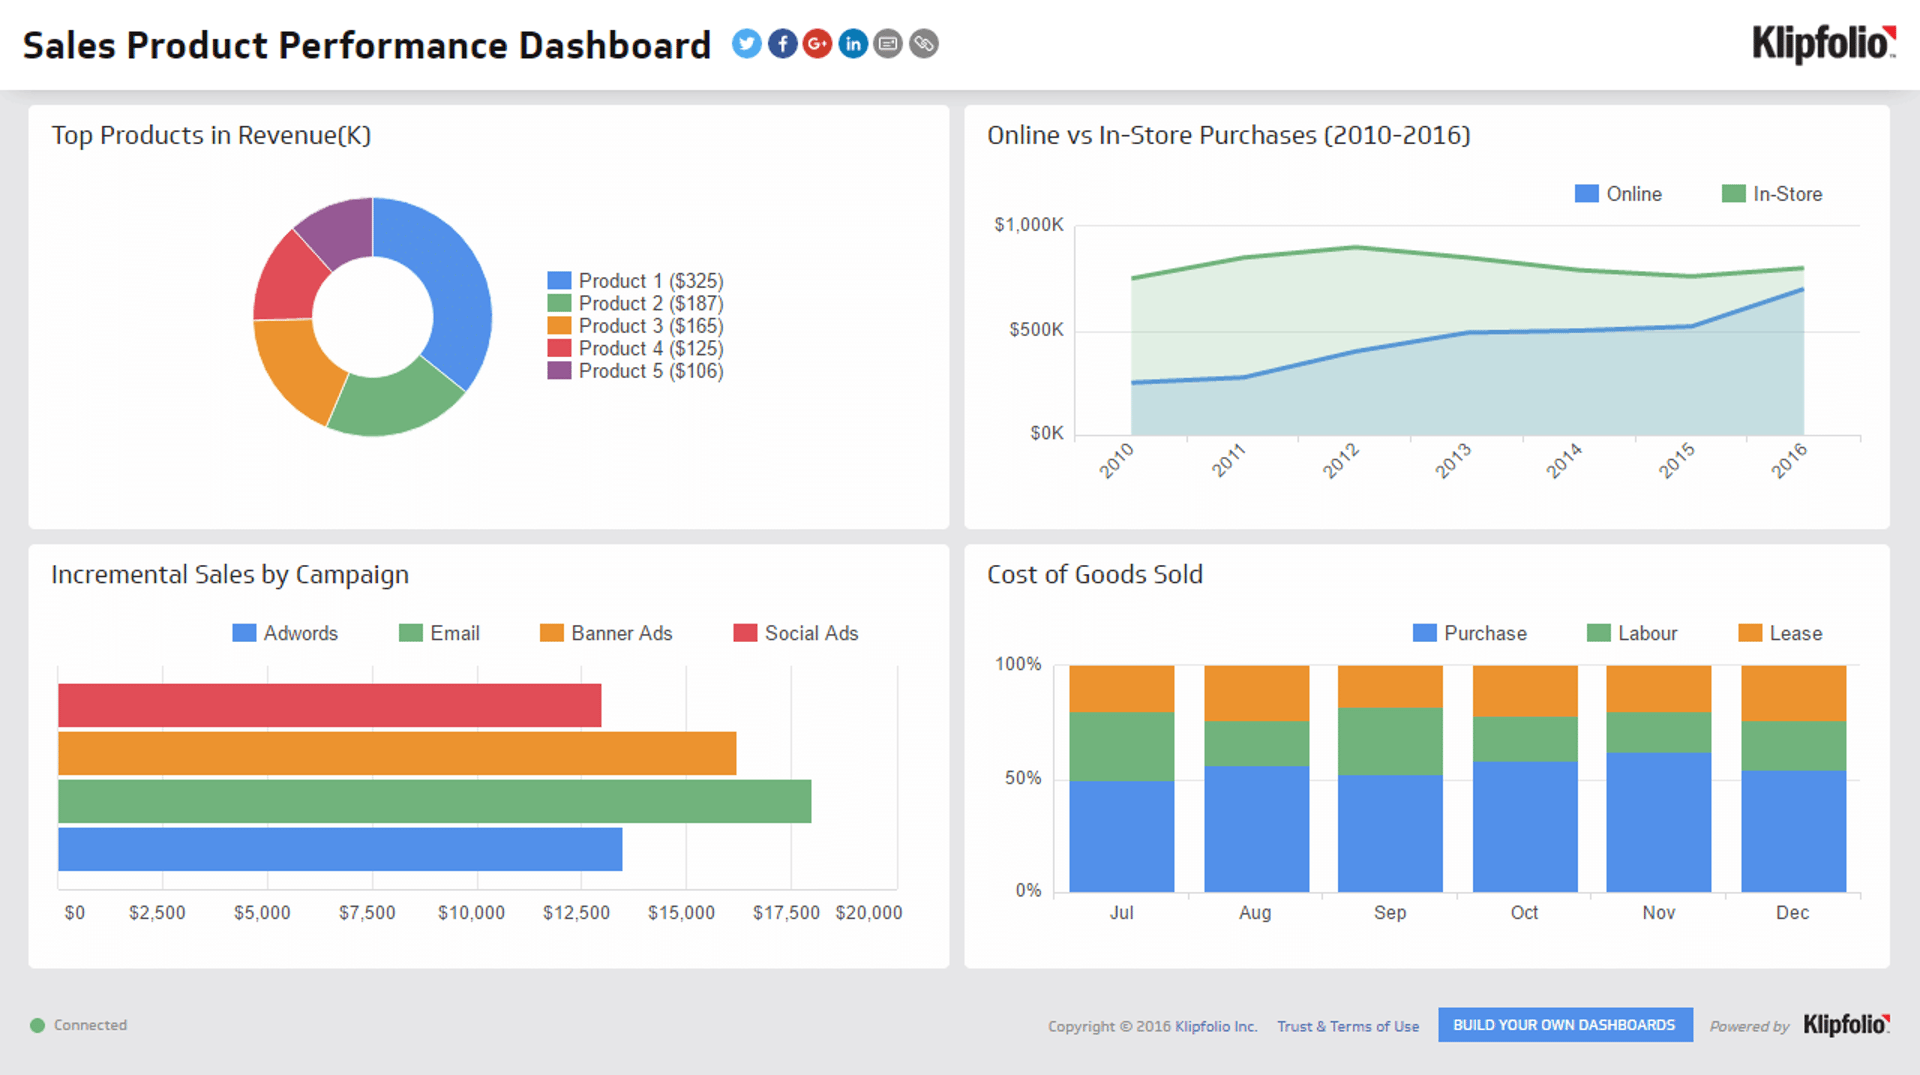
Key metrics to track on a sales leaderboard
In order to build a useful sales leaderboard, it’s important to choose the right dashboard template and sales metrics for your business. Here are metrics that are commonly displayed on sales leaderboards:
- New MRR: monthly revenue from new business deals
- New customers: total number of new users or seats sold
- New logos: number of new business accounts acquired
- Demo calls: pre-sale calls completed by the sales team
- Expansion MRR: new monthly revenue from existing customers
- Retention: the rate at which the sales team holds onto customers
- Onboarding calls: post-sale calls completed by the sales/success team
Related Dashboard Examples