Unlock the value of metrics from
the dbt™ Semantic Layer for everyone
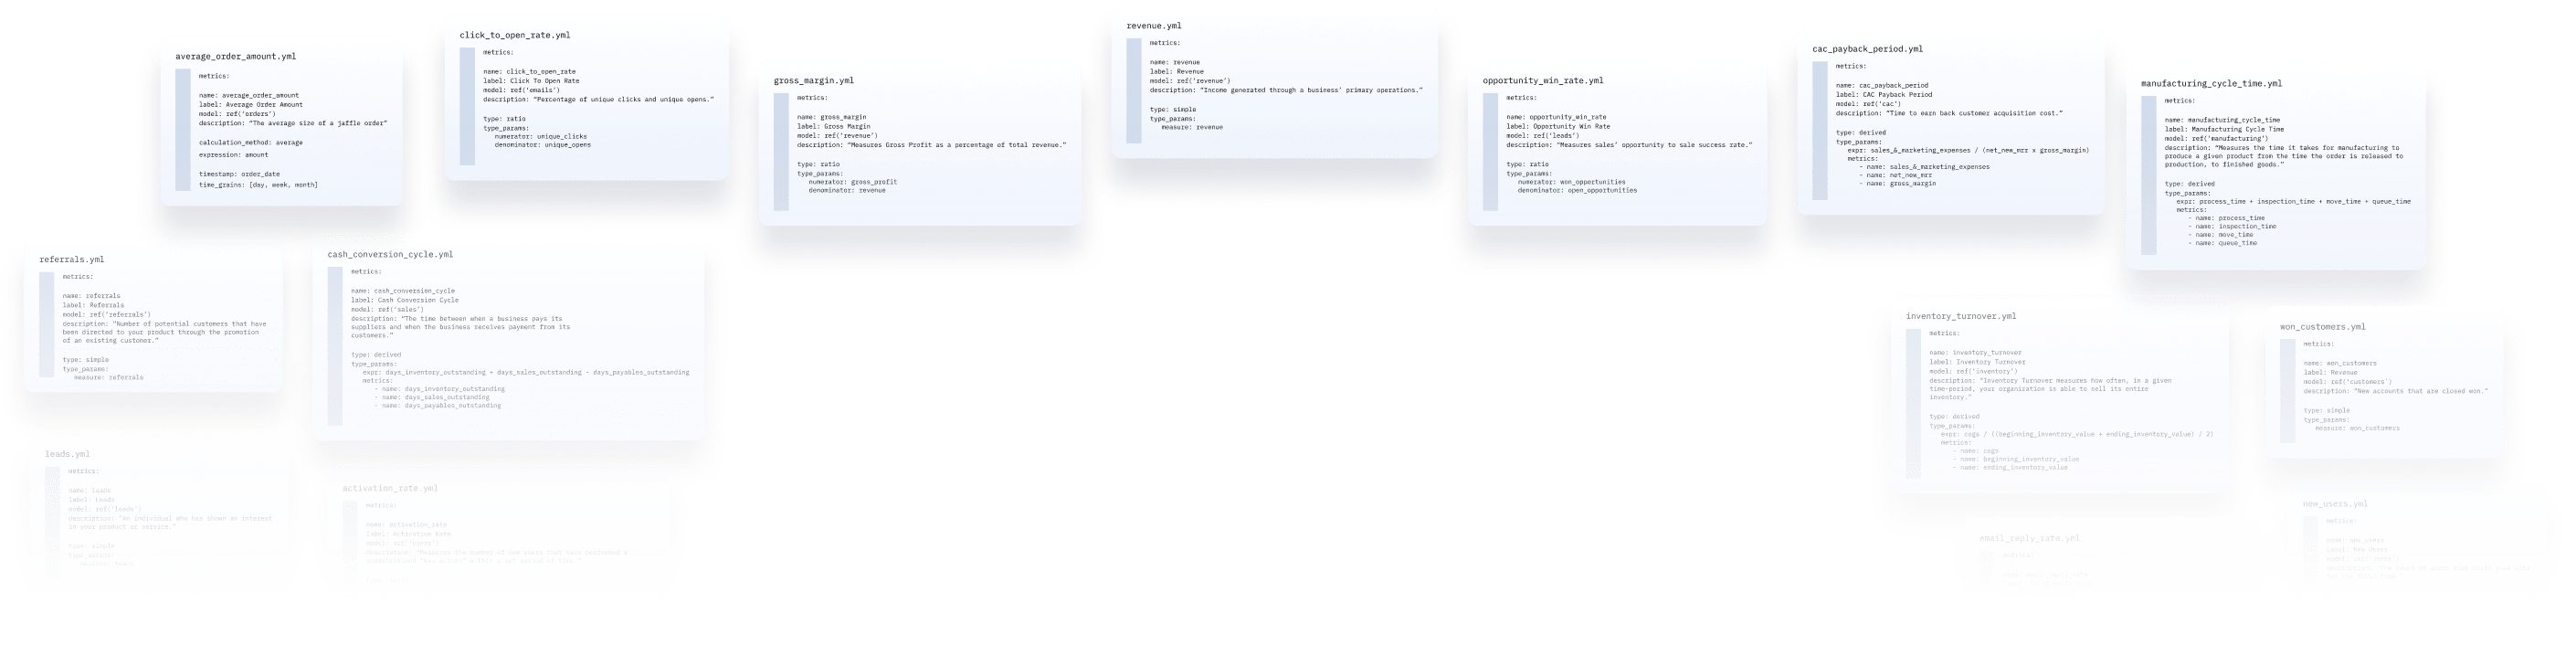
Turn your dbt projects into a metric catalog for business users to confidently analyze and visualize metrics or build dashboards.
“The integration of dbt’s Semantic Layer with PowerMetrics is not just about bringing two technologies together; it’s about creating a synergy that enhances the overall value of data analytics.”

Jeroen Visser, CDO at i-spark

Metrics for the people. All of them.
Enable true self-serve analytics and leverage your investments into the data stack. PowerMetrics is a no-code analytics solution based on an easy-to-use metric catalog. Designed for business teams. Purpose-built for metric consumption.
Data Team
> > > >
Business Users
Connect
Connect your dbt instance
Seamlessly connect to dbt and bring all your metrics into PowerMetrics.
Catalog
Provide a metric catalog
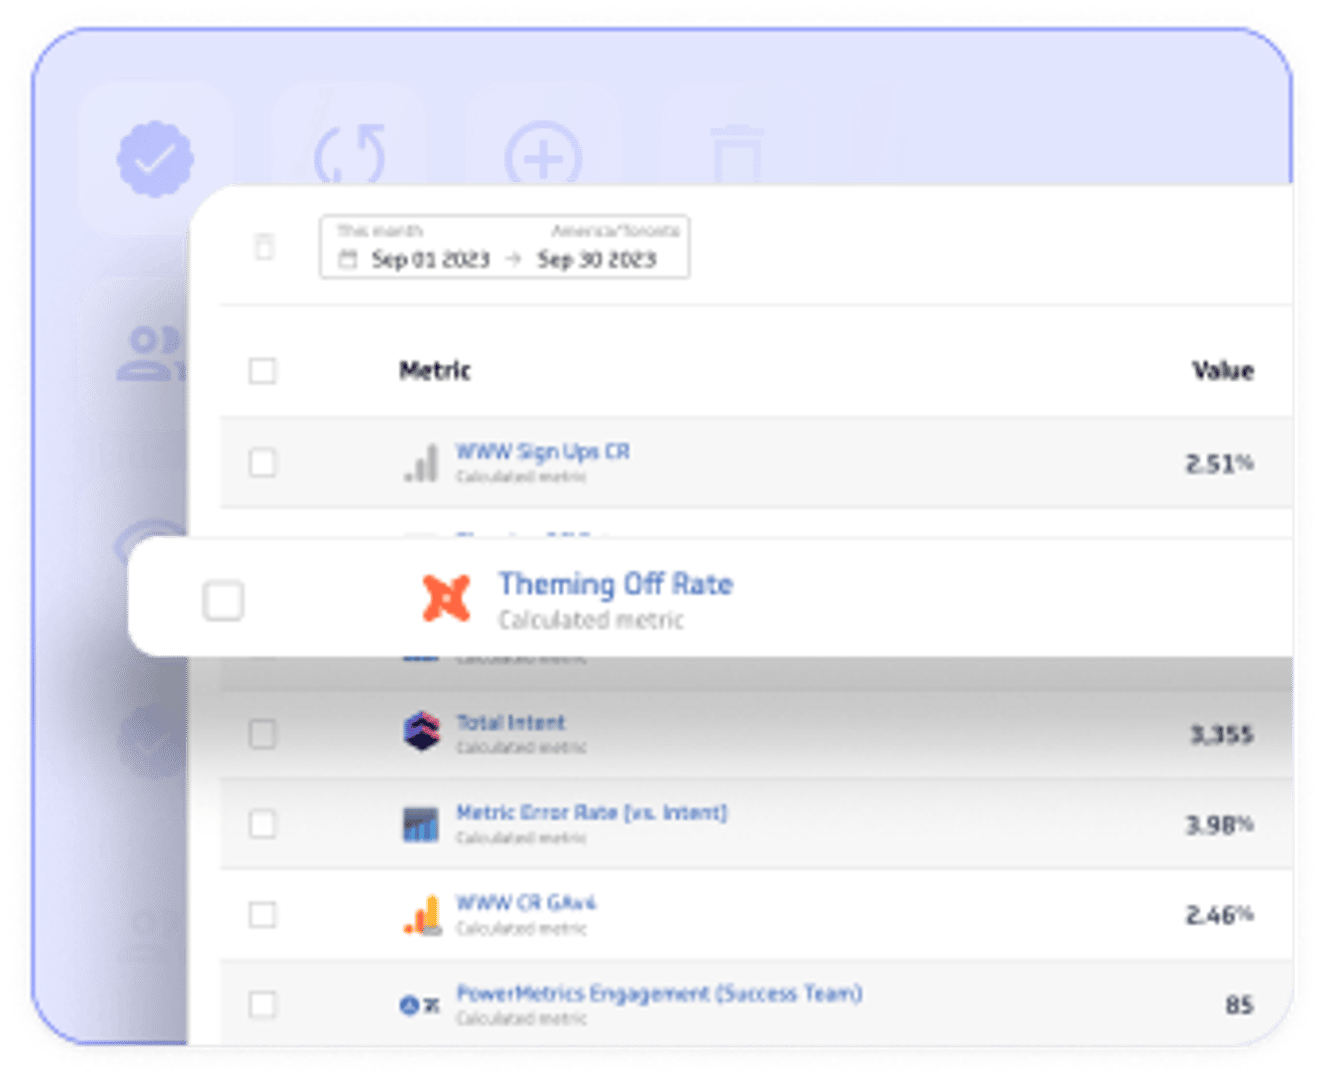
Create a curated metric catalog for your business teams with access control and governance features.
Consume
Self-serve analytics, dashboards, and reports
Have business teams use your dbt metrics for self-serve analytics, visualization, dashboard and report creation.

What is PowerMetrics?
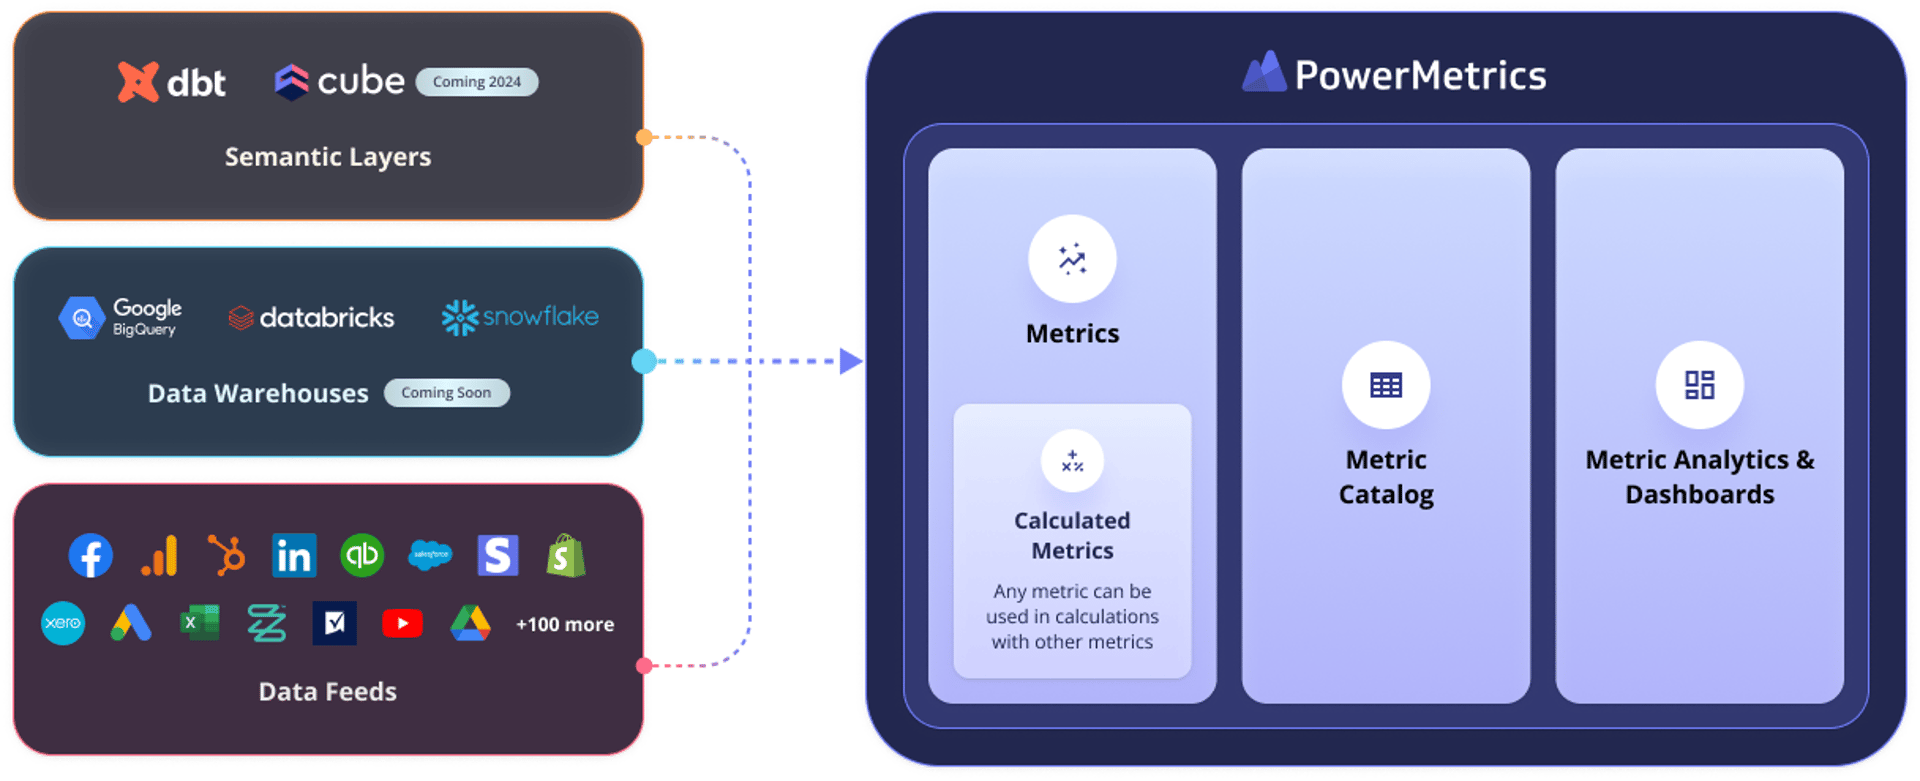
The first hybrid metric solution
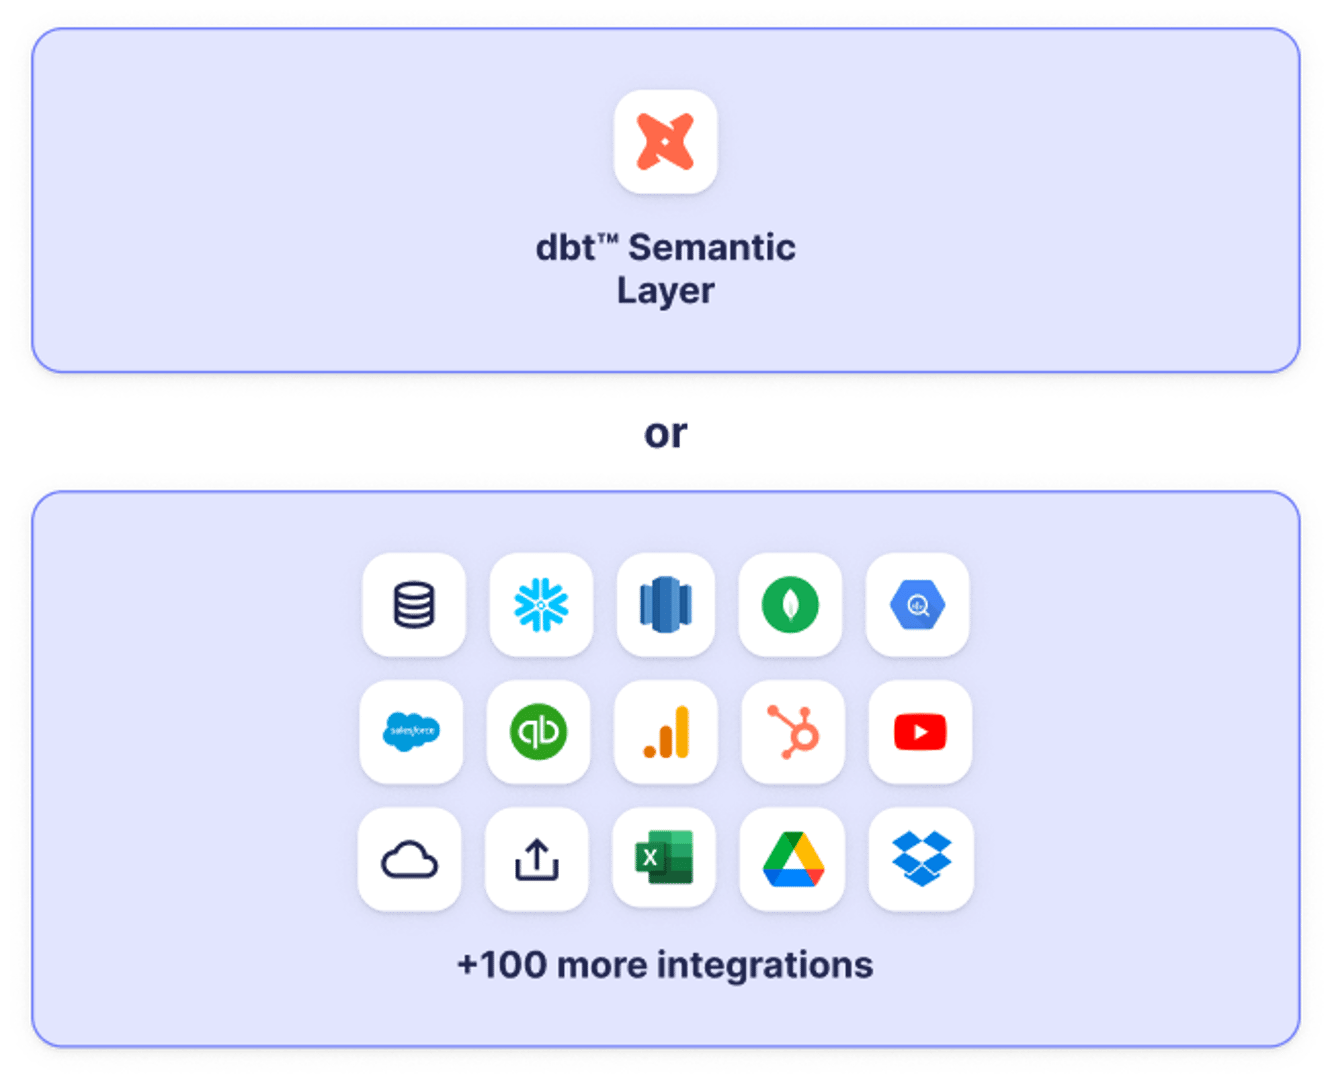
PowerMetrics offers a hybrid approach with multiple methods of connecting metrics to data in the cloud or your infrastructure. Regardless of the type of metric you choose, metrics can be used interchangeably and in combination with metrics from other data sources to perform calculations, analyze, visualize and dashboard your data.
Why use PowerMetrics for my
dbt Semantic Layer metrics?
Self-serve metrics for business users
- The metric catalog makes all your dbt metrics discoverable and usable for everyone, regardless of their technical expertise.
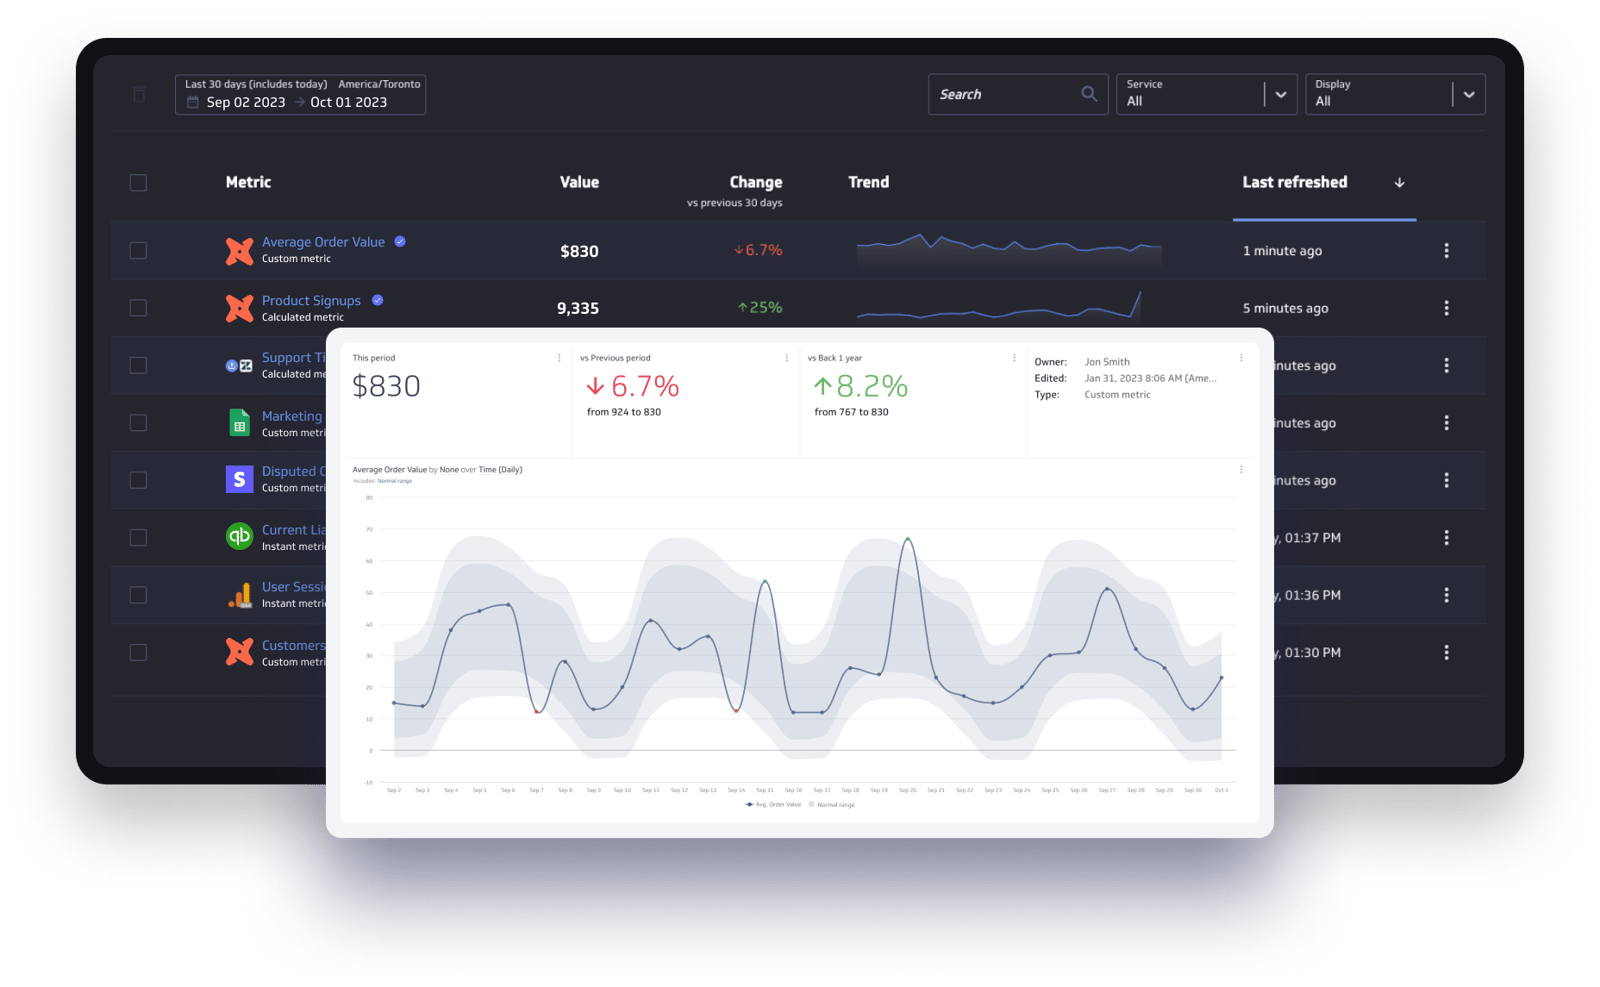
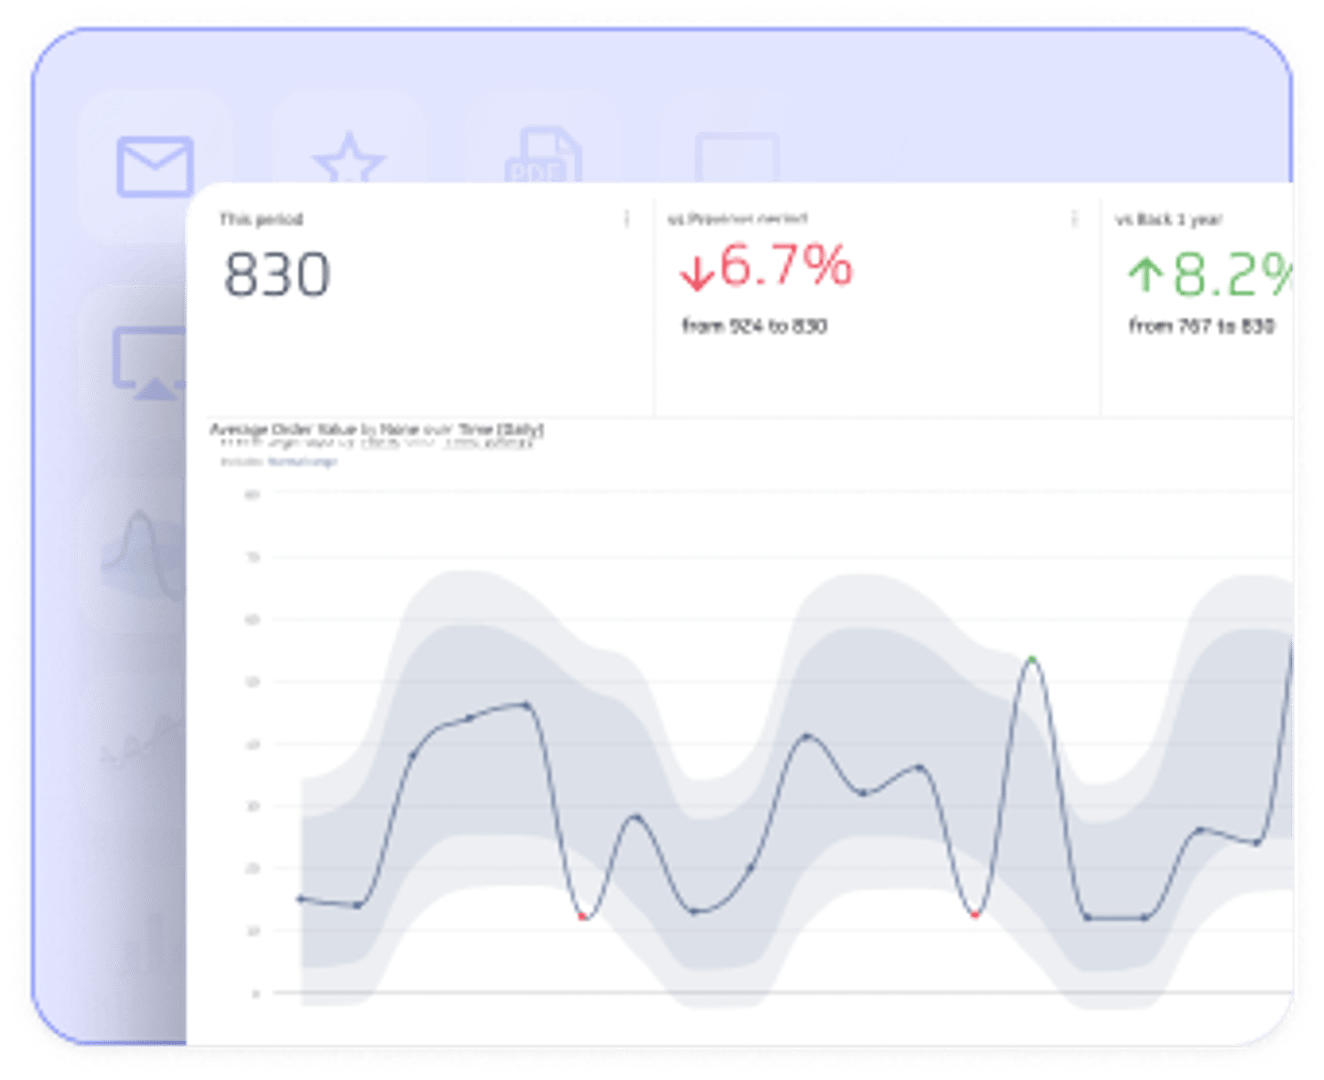
- The straightforward visualization layer is optimized for metrics artifacts, allowing them to be easily explored, analyzed, added to dashboards and shared.
- Goals can be set for metrics and tracked to help monitor business performance.
- PowerMetrics unlocks the value of your data and promotes adoption of metrics across your organization.
Enhanced control with metric management
- Control access to metrics and dashboards.
- Add users, create groups and assign roles and permissions.
- Enable single sign-on (SSO) authentication.
Data source agnostic
- Create metrics for many kinds of services, including those that are not currently supported by dbt Semantic Layer (like cloud services, spreadsheets and other file formats).
- Query data from Snowflake, BigQuery and Databricks (coming soon) *and* maintain your SSOT.
- Combine dbt Semantic Layer metrics with metrics from other services and create calculated metrics.
How to work with dbt Semantic Layer metrics in PowerMetrics
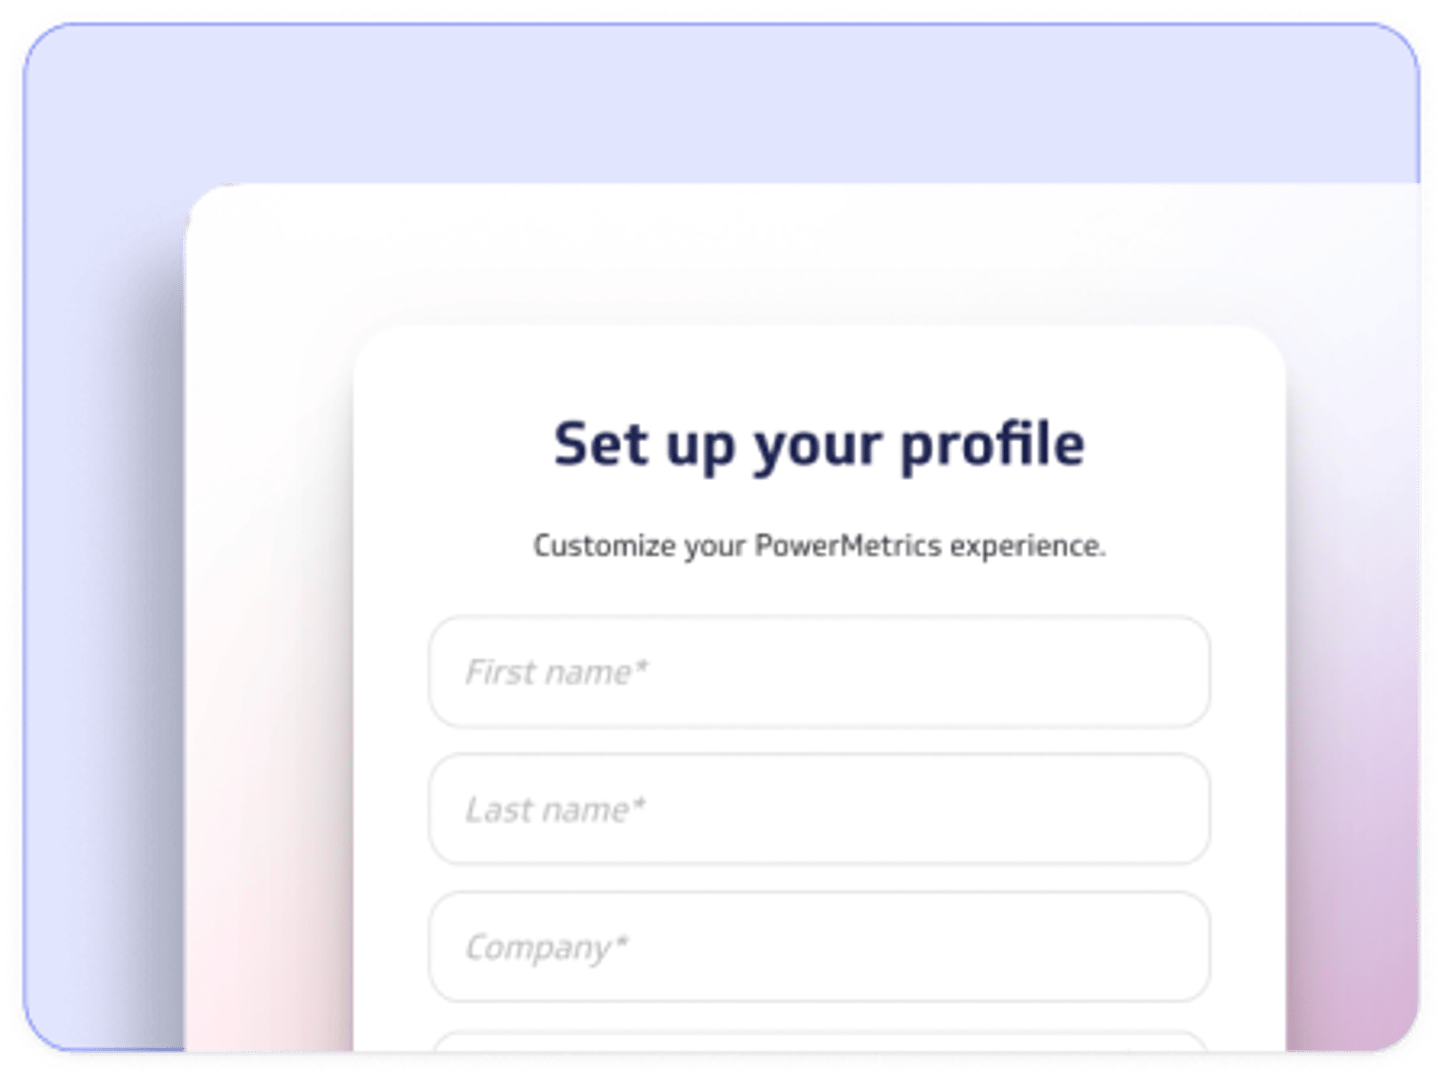
Start a PowerMetrics account
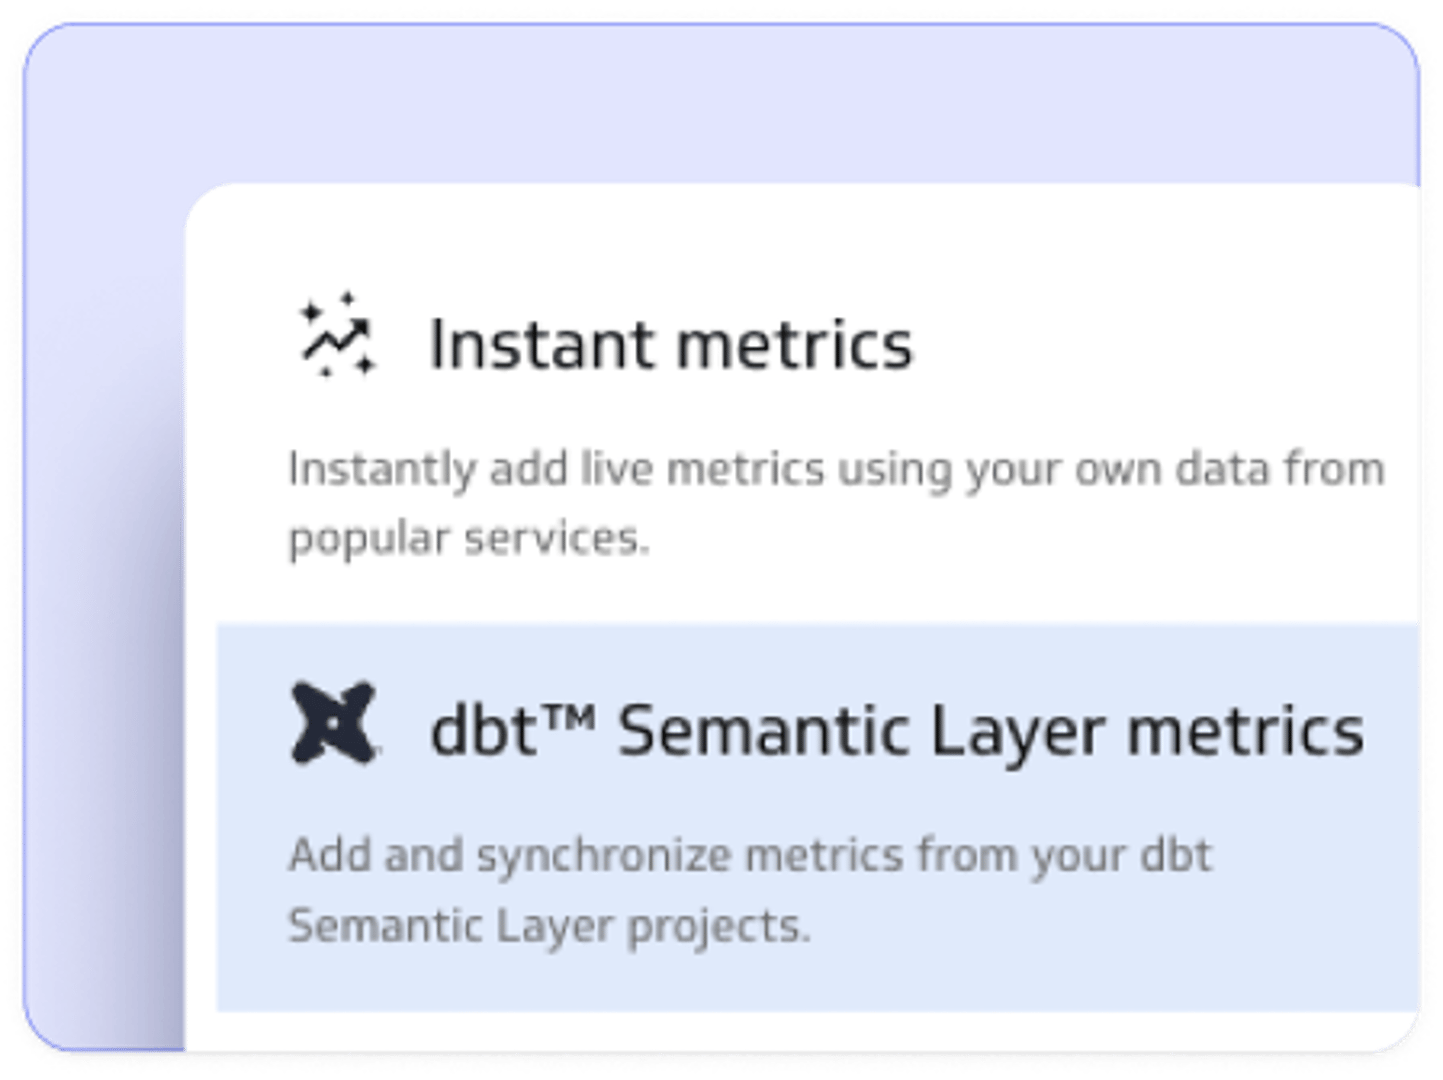
Select "dbt Semantic Layer metrics" when adding metrics to PowerMetrics
Learn more
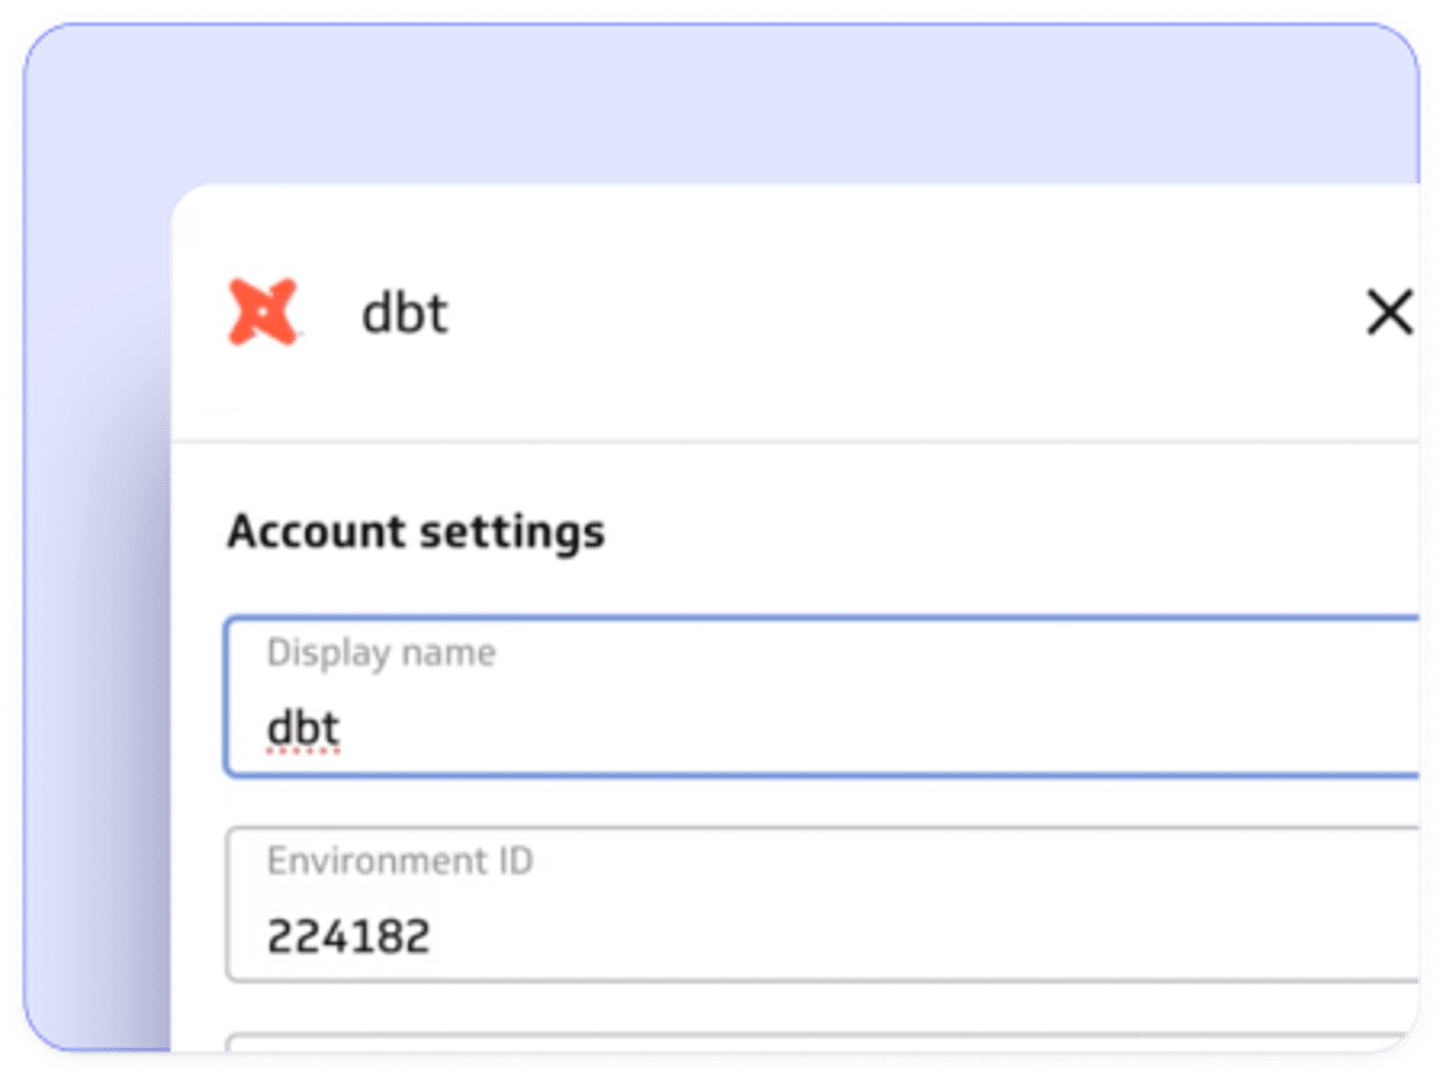
Authenticate your account
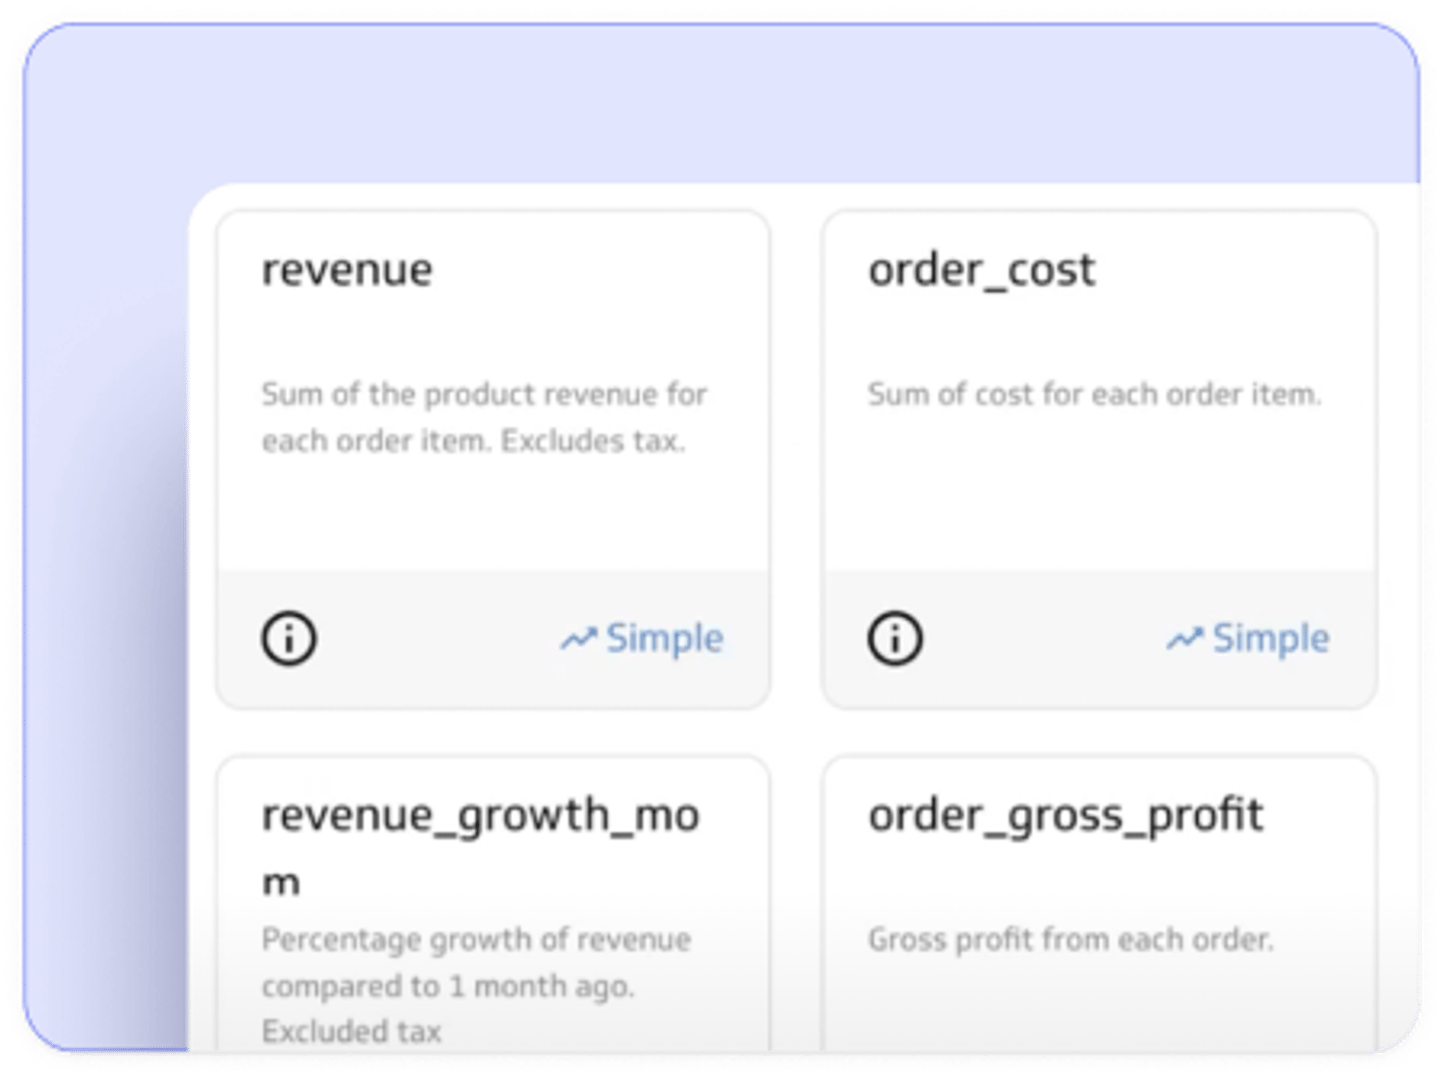
Select the metrics you would like to import from the dbt Semantic Layer
Frequently Asked Questions
PowerMetrics is a self-serve metrics platform and complementary analytics solution. It enables data teams to manage organizational data while providing controlled access to business users with a metrics catalog and streamlined metric-centric analytics.
As a hybrid metrics solution, PowerMetrics has the ability to create native metrics from common file formats and hundreds of data services, import metrics from the dbt™ Semantic Layer and query data directly from Snowflake, BigQuery and Databricks (coming soon). Explore our hybrid integrations approach.
A metric catalog lists and organizes a company's metrics in a centralized location. Curated, certified metrics, managed by the data team, give business users fast access to key data points, improve data consistency, reduce data duplication, and ensure all metrics are meaningful. Governance is assured by granting access rights and permissions at the user level to determine who can view or edit each metric.
A well-defined metrics framework enables faster, more reliable decision making. The consistent structure of metrics allows for effective data monitoring over time and makes it easier to quickly see when there are changes in the data.
Key members of the organization, through careful consideration, decide what each metric measures and how the data is processed. As a result, metrics represent deeply meaningful, well-understood information, based on agreed-upon standards and definitions.
The simplest answer to this question is both! PowerMetrics enables everyone in the organization to work with centralized, trusted metrics, curated by the data team.
Data teams use PowerMetrics as an integration tool within their data stack. They import metrics from the dbt Semantic Layer or perform queries on source data to bring their organizational data into a centralized catalog of metrics, with managed access for business users.
Business teams use PowerMetrics as a self-serve analytics tool by accessing metrics in the catalog, visualizing and exploring data, setting goals, and building their own dashboards and reports.
There are several ways to interact programmatically with PowerMetrics. Please contact us for details and so we can discuss your unique needs.
PowerMetrics uses Amazon Web Services (AWS) in Canada to store and manage customer information and processed data and AWS in Ireland to back up this data. Read our Privacy Statement for more details.
We care deeply about the availability, confidentiality, and integrity of your data. Your continued trust in us is our top priority. Read more about how we protect and ensure privacy of your data.
Yes. You'll find lots of great information in our extensive Documentation and Support Centre. Our in-app chatbot is also available 24/7 to answer your questions. If you need more help, you can count on our top-rated Technical Support Team, who are happy to provide personalized email support. For additional resources, check out our YouTube channel and MetricHQ, the first community-driven dictionary for metrics and KPIs.
Yes. You can create metrics from a wide range of data sources. No matter how they're created, all metric types can be combined and used interchangeably, in calculations, analysis, and visualizations. Learn more about PowerMetrics integrations.
dbt Semantic Layer metrics evolve over time as new data is added to the database or the metric definitions are updated. To ensure metric consumers are always working with the latest version of the data, when changes occur, PowerMetrics is automatically updated to align with the data in dbt Semantic Layer. This is done using a webhook setup whenever a deployment job is successfully run in the dbt Semantic Layer project. Users can also manually align data by clearing the cache for their connected dbt Semantic Layer account in PowerMetrics.
Yes. You can create metrics from data and from calculations based on other metrics. dbt Semantic Layer metrics can be combined with any other metric type to create calculated metrics. Calculated metrics combine metric values using an equation (with simple math - addition, subtraction, multiplication, and division) to create a metric that can be expressed as a number, a percentage, or a ratio. With calculated metrics, dbt users can create the equivalent of a ratio or derived dbt metric. As a bonus, unlike dbt ratio and derived metrics, calculated metrics can be built using metrics from any data source. Read more about creating calculated metrics.